Make better choices faster with an interactive marketing dashboard!
Dashboards bring together numbers from many sources into easy pictures. Spot patterns and compare campaigns and places with one look. But with so much data, how do you know what to watch?
This blog shows the secrets to making powerful displays that cut through the noise. Learn which key numbers matter most to your goals.
Find flexible customization that puts insights in your hands. We'll explore picture types like heat maps and line graphs that turn numbers into stories.
Ultimately, you'll understand how displays make strategic planning and teamwork simple. Boost results by getting stakeholders excited with visual data they can act on.
Don't get lost when focused on important data in marketing as are all you need. Get the guide that transforms data from distraction to decision today!
Before we go into the benefits and applications of marketing dashboards, let's first understand what they are and their significance in the marketing landscape.
Definition and Significance of Marketing Dashboards
A marketing dashboard is a visual representation of data analytics in marketing all the metrics, and key performance indicators (KPIs).
It presents these metrics in an easy-to-understand format, allowing marketers to monitor and analyze data at a glance.
Marketing dashboards are significant because they provide a holistic view of marketing efforts, enabling marketers to make data-backed decisions quickly.

Types of Marketing Dashboards Available
There are various types of marketing dashboards available, each designed to address specific marketing needs. These types of dashboards cater to different aspects of marketing, providing insights and data tailored to specific goals and requirements.
Some common types include:
Performance Dashboards
Performance dashboards focus on tracking KPIs and overall marketing performance. They provide an overview of website traffic, conversion rates, social media engagement, and campaign effectiveness.
Advertising Dashboards
Advertising dashboards focus on monitoring and analyzing advertising campaigns. They provide insights into ad spending, impressions, click-through rates, and return on ad spend (ROAS).
Social Media Dashboards
Social media dashboards concentrate on analyzing social media metrics across platforms. Marketers can track engagement, follower growth, reach, and sentiment analysis to optimize their social media strategies.
Keys to Effective Dashboard Design and Visualization
Effective design and visualization are essential to fully utilize marketing dashboards' power.
Here are some key considerations to keep in mind:
Clear and Concise Visuals
Dashboards should present data clearly and concisely.
Avoid clutter and focus on visualizations that are easy to understand and interpret. Use charts, graphs, and tables strategically to highlight key insights quickly.
Relevant and Actionable Metrics
Choose metrics that are relevant to your marketing goals and objectives.
Identify the KPIs that align with your business objectives and present them prominently on the dashboard.
This ensures that your dashboard provides actionable insights that drive decision-making.
Customization and Flexibility
Marketing dashboards should be customizable to meet the specific needs of your business.
Allow users to filter, drill down, and interact with data to explore insights in a way that is most meaningful to them. This flexibility enables personalized analysis and decision-making.
After understanding marketing dashboard for data analytic in marketing, Now we will see how sata visualization works in marketing dashboards.
Data Visualizations in Marketing Dashboards
Marketing dashboards are powerful tools that provide visual representation and data analytics in marketing.
They consolidate data from various sources and present it in an easily understandable format. One of the key features of marketing dashboards is the ability to use different types of data visualizations.
In this section, we will explore the different types of data visualizations commonly used in marketing dashboards.
Line Charts and Trend Analysis
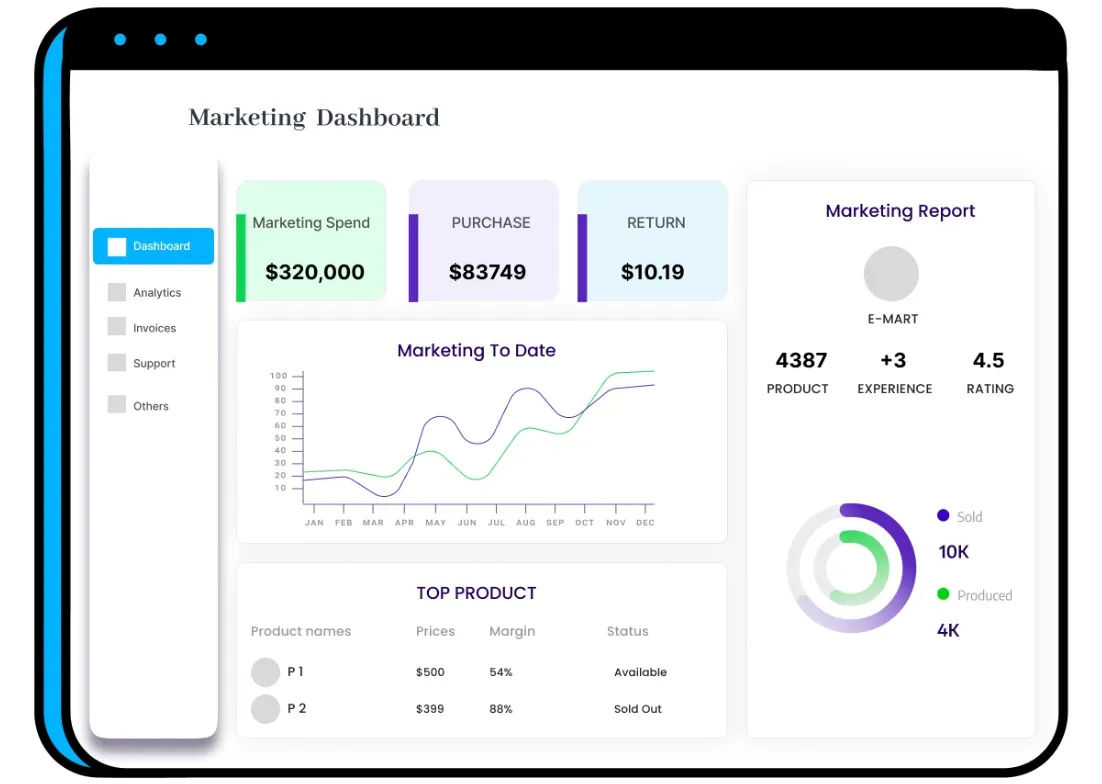
Line charts are a popular data visualization tool used in marketing dashboards to analyze trends and changes in marketing performance over time.
With a line chart, marketers can easily spot patterns, identify upward or downward trends, and track the progress of key metrics.
Examples of Line Chart Use in Marketing Dashboards
Monitoring website traffic over some time
Analyzing the growth of social media followers
Tracking the number of leads generated by marketing campaigns
Observing changes in conversion rates
Bar Charts and Performance Comparisons
Bar charts are excellent for comparing metrics and key performance indicators (KPIs).
They provide a clear visual representation of performance and allow marketers to identify top performers or areas that need improvement quickly.
Examples of Bar Chart Use in Marketing Dashboards
Comparing the performance of different advertising campaigns
Analyzing the effectiveness of various marketing channels
Comparing the return on investment (ROI) of different marketing campaigns
Identifying the most popular products or services based on sales volume
Heat Maps and Geography Visualization
Heat maps are an effective way to visualize data based on geography.
They use color gradients to represent data points, allowing marketers to understand location-based patterns, customer distribution, and other geographical insights.
Examples of Heat Map Use in Marketing Dashboards
Analyzing customer demographics and geographical distribution
Tracking the performance of marketing campaigns in different regions
Identifying areas with high customer density or potential market opportunities
Monitoring customer sentiment or engagement by location
Now, Let us see how design and customization work in the marketing dashboard.
Suggested Reading:
Dashboard Design and Customization
Designing marketing dashboards tailored to business needs is essential for effective data analysis and decision-making.
Here are some key considerations when designing and customizing marketing dashboards.
Choosing the Right KPIs
Selecting the most accurate key performance indicators (KPIs) is crucial for a marketing dashboard. These metrics should align with the business objectives and provide meaningful insights.
When determining the KPIs that matter most, consider what metrics will help track progress toward strategic goals, measure success, and drive actionable decisions.
Customizing Marketing Dashboards to Business Needs
Every business has unique needs and goals. Marketing dashboards should be customizable to meet these specific requirements.
By providing options for customization, such as the ability to filter data, set date ranges, and focus on specific metrics, marketers can tailor the view to their specific needs. This ensures that the dashboard provides the most relevant information for decision-making.
Integrating Different Data Sources
Marketing dashboards are most effective when they can integrate data from various sources.
By connecting to different data platforms and using APIs or connectors, marketers can consolidate data from sources such as website analytics, social media platforms, CRM systems, and more.
This integration provides a comprehensive view of marketing performance and allows for more accurate analysis and decision-making.
Let us see some of the benefits of data visualization in marketing decision-making.
Benefits of Data Visualization for Marketing Decision-Making
According to the adage, "a picture is like a thousand words." This statement could not be more accurate when it comes to marketing decisions.
Data visualization is a powerful tool that has the potential to transform how marketers perceive and analyze data.
In this part, we'll look at the advantages of data visualization in marketing decision-making.
Improved Insights and Understanding
Data visualization enhances the understanding of marketing data by presenting complex information in a visual and easily understandable format.
Instead of sifting through rows and columns of numbers, marketers can gain new insights by visually exploring and interacting with data.
Trends, patterns, and outliers become more apparent, leading to a deeper understanding of marketing performance.
More Efficient and Effective Strategic Planning
Strategic planning is a critical aspect of marketing decision-making.
Marketing dashboards equipped with data visualizations streamline the strategic planning process.
By consolidating data from multiple sources into a single dashboard, marketers can easily monitor performance, track progress toward goals, and identify areas for improvement.
Better Communication and Collaboration
Effective communication and teamwork are essential for making sound marketing decisions.
Marketing dashboards using data visualizations improve collaboration by engaging everyone with a similar visual language.
Data visualizations are more exciting and simpler, allowing marketers, managers, and other stakeholders to communicate more effectively.
After the benefits we will discuss key aspects of dashboard implementation and deployment.
Suggested Reading:
Choosing the Right Marketing Analytics Tools for Your Business
Dashboard Implementation and Deployment
Implementing and deploying marketing dashboards requires careful consideration to ensure their effectiveness and reliability.
In this section, We will discuss key aspects of dashboard implementation and deployment.
Choosing the Right Tools and Platforms
Selecting the right tools and platforms to develop and deploy marketing dashboards is crucial for success.
There are numerous options available, each with its strengths and weaknesses. It's important to evaluate your organization's specific needs and choose a tool or platform that aligns with those needs.
Factors to consider include ease of use, data integration capabilities, customization options, and scalability.
Ensuring Data Accuracy and Integrity
Data accuracy and integrity are essential when creating marketing dashboards. More accurate or adequate data may give rise to accurate conclusions and better decision-making.
Implementing quality assurance processes, such as regular data audits and validation checks, is necessary to ensure data reliability. It's also important to have data governance policies in place to maintain the integrity of the data used in the dashboards.
User Training and Adoption
Encouraging user adoption and engagement with marketing dashboards is critical for their success. Even the most powerful dashboard is only helpful if users understand how to utilize it effectively.
Providing comprehensive training and support to users is essential to ensure successful implementation. This might include training sessions, user manuals, and continuous assistance for queries or problems.
Conclusion
Data visualization is a powerful tool for making strategic marketing decisions. Through dashboards, you can transform raw numbers into clear insights that drive action.
By selecting the right metrics and designing intuitive visuals, dashboards cut through data clutter. They reveal patterns, compare campaigns, and spotlight what really moves the needle.
With the right implementation, dashboards engage teams and stakeholders. Everyone can understand performance at a glance.
And beginning with such automation isn't that tough either. Meet BotPenguin- the home of chatbot solutions.
With the combined benefits of CRM and Chatbots, BotPenguin makes automation services like lead generation and customer support more effective by unifying marketing and sales efforts in one place:
- Marketing Automation
- WhatsApp Automation
- Customer Support
- Lead Generation
- Facebook Automation
- Appointment Booking
Customization ensures the display focuses discussion where it matters most. Ultimately, dashboards streamline planning and collaboration.
They put the power of data behind decisions that boost results. Start visualizing your marketing analytics today for better, faster choices tomorrow.
Frequently Asked Questions (FAQs)
What is a marketing dashboard?
A marketing dashboard is a visual representation of key marketing metrics and data analytics in marketing from various sources. It provides marketers with a centralized view of their marketing performance to aid in decision-making and strategic planning.
Why are marketing dashboards important for businesses?
Marketing dashboards are important for businesses because they provide a clear, concise overview of marketing data. They help identify trends, measure campaign effectiveness, and make data-driven decisions to optimize marketing strategies and maximize ROI.
What types of data can be visualized on a marketing dashboard?
A marketing dashboard can visualize various types of data, including website traffic, conversion rates, social media engagement, email performance, lead generation, customer acquisition, and revenue attribution.
What are the benefits of using a marketing dashboard?
Using a marketing dashboard offers benefits such as real-time data visualization, easy data interpretation, improved decision-making, enhanced collaboration, quicker access to insights, and the ability to track progress towards marketing goals.
How can businesses create a marketing dashboard?
To create a marketing dashboard, businesses need to identify their key metrics, select a dashboard tool or platform, connect data sources, design visualizations, create interactive reports, and regularly update and refine the dashboard based on evolving needs.
Are there any recommended marketing dashboard tools or platforms?
Yes, there are several recommended marketing dashboard tools and platforms available, including Google Data Studio, Tableau, Klipfolio, Power BI, and Domo. These tools offer flexible customization options and integrations with various data sources.

