What is Analytics?

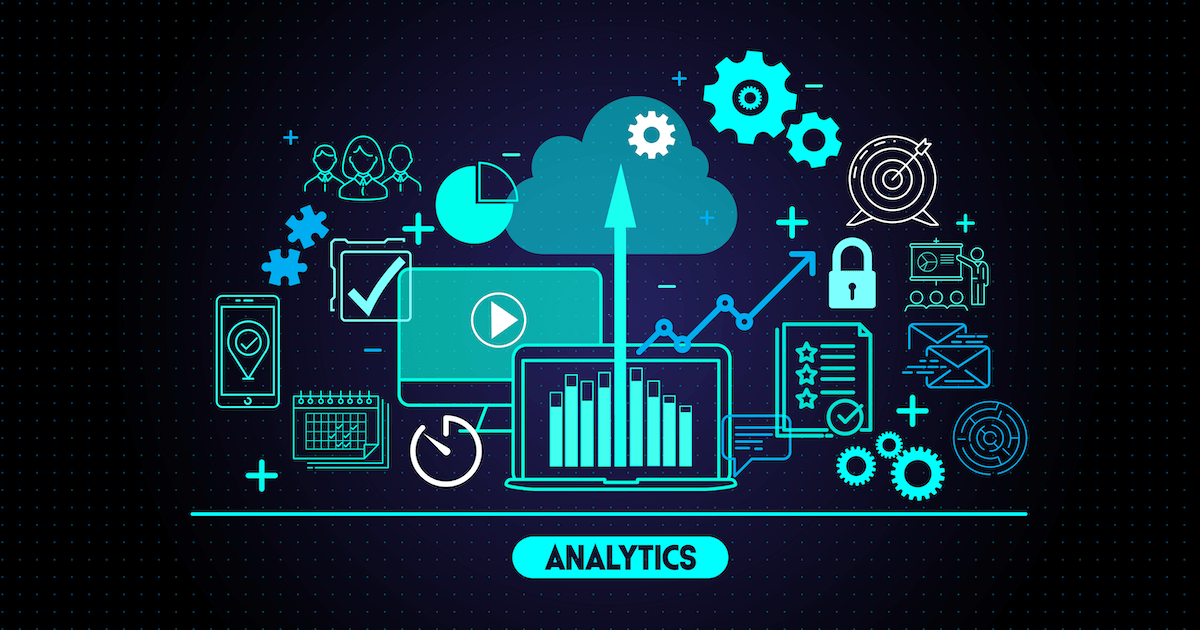
Analytics collects, processes, and analyzes data to gain insights and make informed decisions. Analytics can be used for a variety of purposes, from improving website performance to optimizing marketing campaigns to predicting customer behavior.
Why is Analytics important?
Analytics is important because it helps businesses make data-driven decisions. By analyzing data, businesses can identify patterns and trends that they may not have been aware of otherwise and use that information to improve their strategies and tactics.
How does Analytics Work?
Analytics collects data from various sources, processes it to clean and transform it, and analyzes it to extract insights. There are various types of analytics, including descriptive, diagnostic, predictive, and prescriptive analytics, each with its own methods and techniques.
What are the key applications of Analytics?
Analytics can be used for a wide range of applications, including:
- Website and app performance optimization
Marketing and advertising campaign analysis
Customer behavior prediction and analysis
Sales and revenue forecasting
Supply chain and logistics optimization
Key Analytics Terms
1. Metrics and KPIs

Metrics and KPIs are used to measure performance, but some key differences exist. Metrics are any kind of data point that can be measured, while KPIs are specific metrics that are tied to business objectives. Examples of metrics include website traffic, conversion rate, and average order value, while examples of KPIs include customer acquisition cost, customer lifetime value, and return on investment (ROI).
2. Dimensions
Dimensions are attributes of your data that you can use to segment and filter your data. Examples of dimensions include time, geography, and device type. By using dimensions, you can better understand how different segments of your audience behave and how they interact with your website or app.
3. Segments
Segments are subsets of your data that you can use to analyze specific groups of users or events. By creating segments, you can gain insights into how different groups behave and tailor your strategies accordingly. Examples of segments include first-time visitors, returning customers, and high-value customers.
4. Funnel
A funnel is a series of steps users go through on your website or app, from initial visit to conversion. By analyzing the funnel, you can identify areas where users are dropping off and optimize those areas to improve conversion rates. Examples of funnel steps include homepage visits, product page views, cart addition, and checkout completion.
5. Attribution
Attribution is the process of assigning credit to different marketing channels for driving conversions. There are various attribution models, including last-click, first-click, and multi-touch. By analyzing attribution, you can determine which channels drive the most value for your business and optimize your marketing spend accordingly.
Web Analytics
Web analytics analyzes website data to gain insights into user behavior and performance. Web analytics can track metrics like website traffic, pageviews, bounce rate, and conversion rate.
Key Metrics to Track in Web Analytics
There are several key metrics that you should track in web analytics, including:
Website Traffic: The number of visitors to your website, broken down by source (e.g. direct, organic search, paid search, social media).
Pageviews: The number of times a page on your website has been viewed.
Bounce Rate: The percentage of visitors who leave your website after viewing only one page.
Conversion Rate: The percentage of visitors who complete a desired action on your website, such as purchasing or filling out a form.
Average Time on Page: The average amount of time visitors spend on a specific page.
Web Analytics Tools
Many web analytics tools are available, including Google Analytics, Adobe Analytics, and Piwik. These tools allow you to track and analyze website data, create reports, and gain insights into user behavior and performance.
Social Media Analytics

Social media analytics is analyzing social media data to gain insights into user behavior and social media performance. Social media analytics can be used to track metrics like follower count, engagement rate, and reach.
Key Metrics to Track in Social Media Analytics
There are several key metrics that you should track in social media analytics, including:
Follower Count: The number of people who follow your social media account.
Engagement Rate: The percentage of followers who engage with your social media content, such as liking, commenting, or sharing.
Reach: The number of people who have seen your social media content.
Click-Through Rate: The percentage of people who clicked on a link in your social media content.
Social Media Analytics Tools
Many social media analytics tools are available, including Hootsuite, Sprout Social, and Buffer. These tools allow you to track and analyze social media data, create reports, and gain insights into user behavior and performance.
Email Marketing Analytics
Email marketing analytics analyzes email data to gain insights into user behavior and email performance. Email marketing analytics can be used to track metrics like open rate, click-through rate, and conversion rate.
Key Metrics to Track in Email Marketing Analytics
There are several key metrics that you should track in email marketing analytics, including:
Open Rate: The percentage of people who opened your email.
Click-Through Rate: The percentage of people who clicked on a link in your email.
Conversion Rate: The percentage of people who completed a desired action after clicking on a link in your email.
Email Marketing Analytics Tools
Many email marketing analytics tools are available, including Mailchimp, Constant Contact, and Campaign Monitor. These tools allow you to track and analyze email data, create reports, and gain insights into user behavior and email performance.

