G2
"Their ability to execute in a timely manner. If you want to start an AI Chatbot business then this is the place. - They have a great work environment, and know how important it is to be efficient."
- Gustav Louv
5-Star Rating
Visualize the chatbot’s performance and see how you can improve the efficiency of your business with our smart dashboard.
FREE Forever plan. No Credit Card Required.Trusted by 50,000+ Global Brands


We’ve spent hundreds of hours understanding relevant KPIs for each business. Whether it is understanding customer conversion rates or evaluating business impact, we’ve got it all covered.
Keep a track of your chatbot’s performance on a daily, weekly, and monthly basis.
Understand which channel is most loved by your target audience.
Perform A/B tests for different conversation flows to understand customer interaction behavior.
Measure the performance of WhatsApp chatbot and campaigns through a dedicated advanced dashboard.

Get weekly updates about your support team’s performance through multiple KPIs.
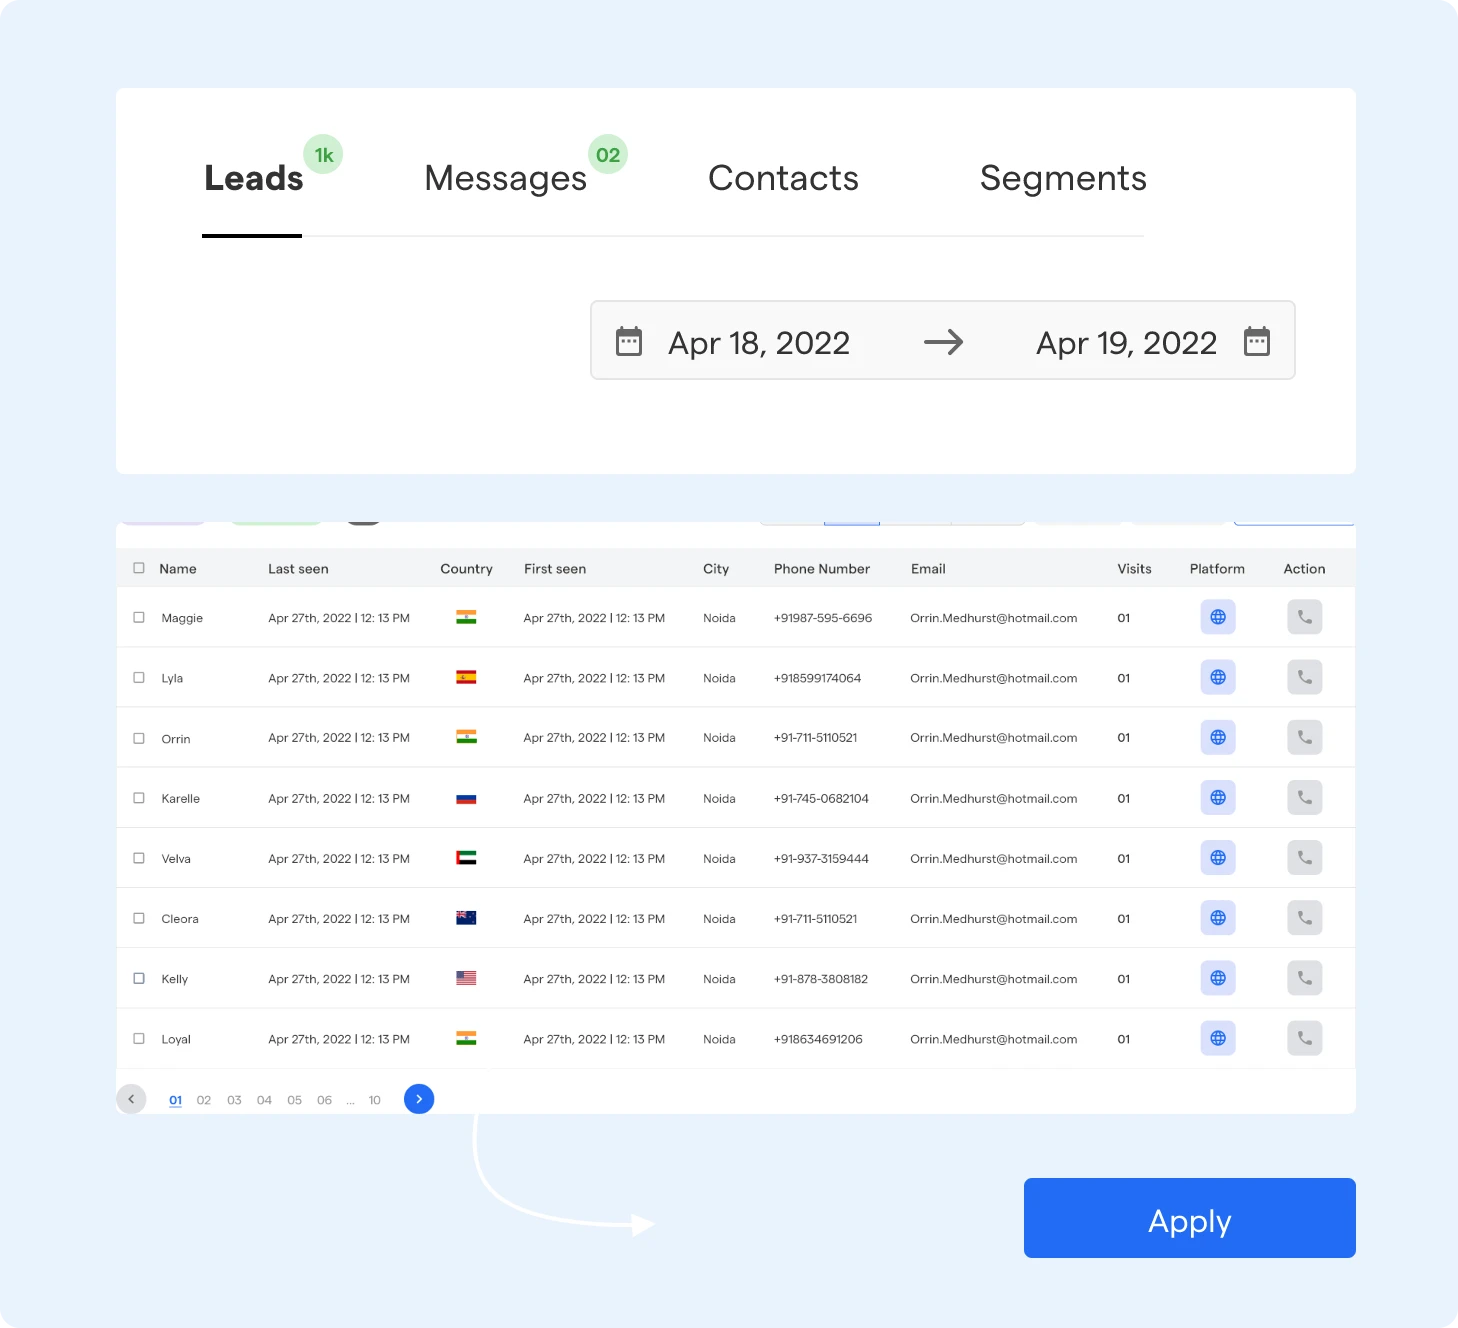
Examine the number of leads and messages acquired by a particular bot and the assigned agent.
See how many leads, messages are pushed into the pipeline by the various channels and which agent handles them.
Analyse customer interactions with chatbot to smartly segment your audience based on behavioural data.
Use chatbot analytics data to improve the lead generation process and reduce costs by decreasing human intervention.

Install AI Chatbot on your website and enhance your team’s performance by supporting them with a smart and analytical virtual assistant.
We define values for each contact so you can see specific pipeline attributions by your chatbots. Download leads collected by chatbot as CSV files.
Customize the messages according to the customer behavior analysis from different chatbots to improve ROI.
Through metrics such as hours saved, conversion rates, engagement rates, abandonment rates and more, understand what works best for your business.
Ease the workload of your marketing team using an analytical AI chatbot that captures user’s data and helps understanding consumer behaviour.

Control the flow of your data by integrating your existing softwares and tools with BotPenguin’s AI chatbot.
ChatGPT
HubSpot
Bitrix24
Go High Level
Acuity Scheduling
Zoho CRM
Pabbly
Zapier
Twilio
Pipedrive CRM
Google Calendar
Google Sheets
and more than 80 tools to integrate
What metrics does the chatbot analytics dashboard track?
The AI chatbot analytics dashboard tracks metrics like conversation volume, response time, chatbot usage and conversational flow performance to help optimize chatbot efficiency.
How can chatbot analytics tools help improve customer engagement?
Chatbot analytics tools track key data, allowing you to refine interactions, enhance engagement, and improve user satisfaction.
Can I monitor chatbot performance across different platforms?
Yes, a chatbot analytics platform provides insights across platforms like WhatsApp and Facebook to track engagement and performance.
How does the chatbot analytics dashboard help in improving conversion rates?
The chatbot analytics dashboard tracks goal completion rates, showing how effective your bot is at driving conversions.
What is the fallback rate, and why is it important?
The fallback rate, tracked by chatbot analytics software, measures how often your bot struggles to provide accurate responses.
Can I integrate chatbot analytics with Google Analytics?
Yes, you can integrate and chatbot analytics tool like Google Analytics chatbot tracking to get detailed insights into user behavior and chatbot performance.
Delivering value, earning trust. Hear good words about BotPenguin on these platforms.