Introduction
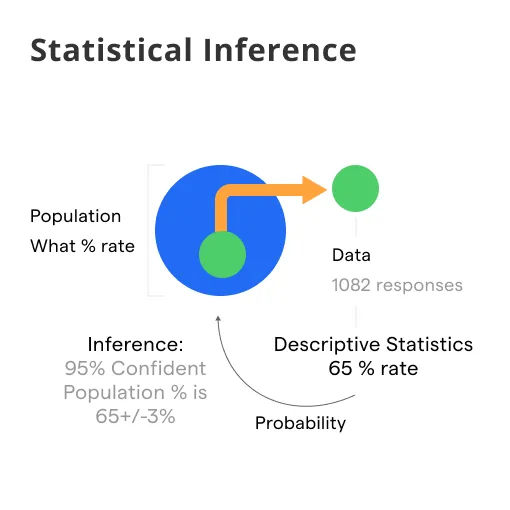
Statistical Inference is a fundamental concept in the field of statistics, providing tools and methods to make judgments about a larger population based on data from a sample.
This glossary covers essential terms related to inference statistics definition aiming to clarify its purpose, techniques, and so on.
What is Statistical Inference?
Let's start with the basic understanding of inference statistics definition.
Inference Statistics Definition
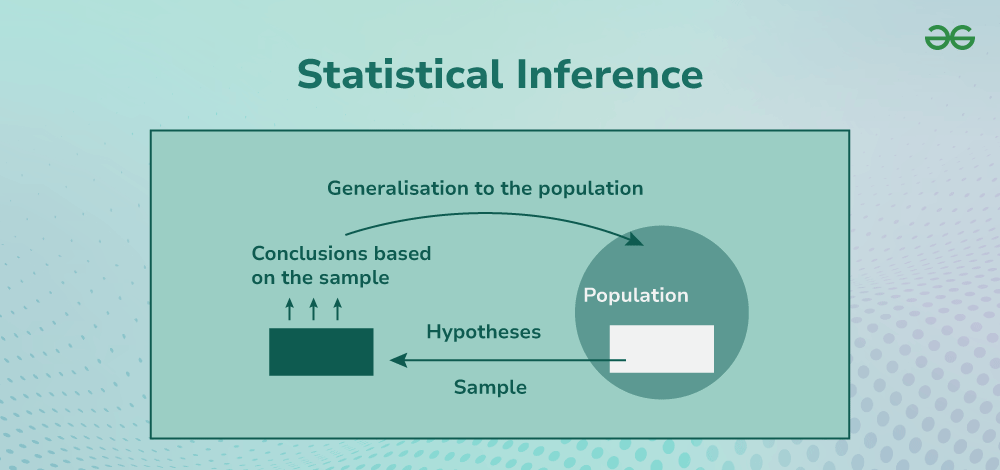
Statistical Inference refers to the process of concluding data that is subject to random variation. In essence, it allows statisticians to make predictions or decisions about a population based on information gathered from a sample.
By applying statistical inference, researchers and analysts can estimate parameters, test hypotheses, and assess the likelihood of various outcomes.
Statistical Inference and Descriptive Statistics
Statistical Inference and Descriptive Statistics are essential components of data analysis.
Descriptive Statistics focuses on summarizing and organizing data, providing insights into the sample through measures like mean and variance.
In contrast, Statistical Inference allows researchers to conclude a population based on sample data, involving hypothesis testing and parameter estimation.
Understanding Statistical Inference and Descriptive Statistics is crucial, as descriptive methods establish a foundation for making broader inferences.
By integrating both, analysts can effectively interpret data, derive meaningful conclusions, and make informed decisions. It also reflects the characteristics of the entire population based on sample observations.
Key Concepts in Statistical Inference
This section explores essential ideas in inference in statistics that help researchers analyze sample data to make accurate population-level conclusions.
Population and Sample
In statistical inference, a population refers to the entire group being studied, while a sample is a subset of that population. Inference in statistics relies on samples to conclude the larger population.
Parameter and Statistic
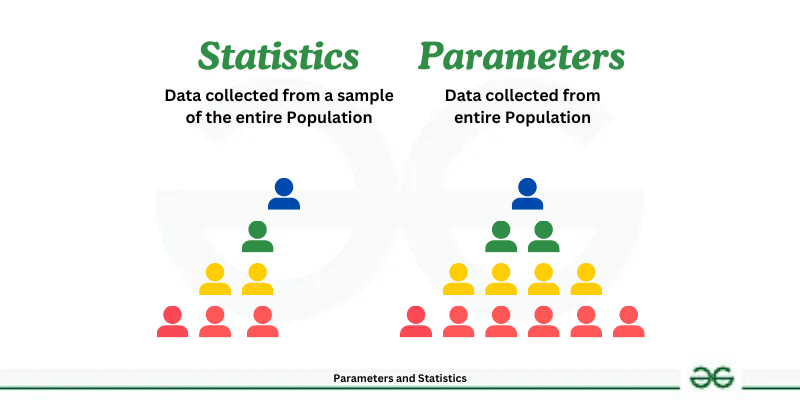
A parameter is a numerical characteristic of a population (e.g., population mean), whereas a statistic is a numerical characteristic of a sample (e.g., sample mean).
Statistical inference uses sample statistics to estimate population parameters.
Hypothesis Testing
Hypothesis Testing is a method of statistical inference used to assess the validity of a claim about a population parameter. It involves:
- Null Hypothesis (H0): The statement that there is no effect or difference, and any observed difference is due to sampling variability.
- Alternative Hypothesis (H1): The statement that there is an effect or difference. Hypothesis tests use test statistics to determine whether to reject the null hypothesis.
Confidence Interval
A Confidence Interval is a range of values derived from sample data that likely contains the population parameter.
It provides an estimate of the parameter with an associated level of confidence, typically expressed as a percentage (e.g., 95%).
Significance Level (Alpha)
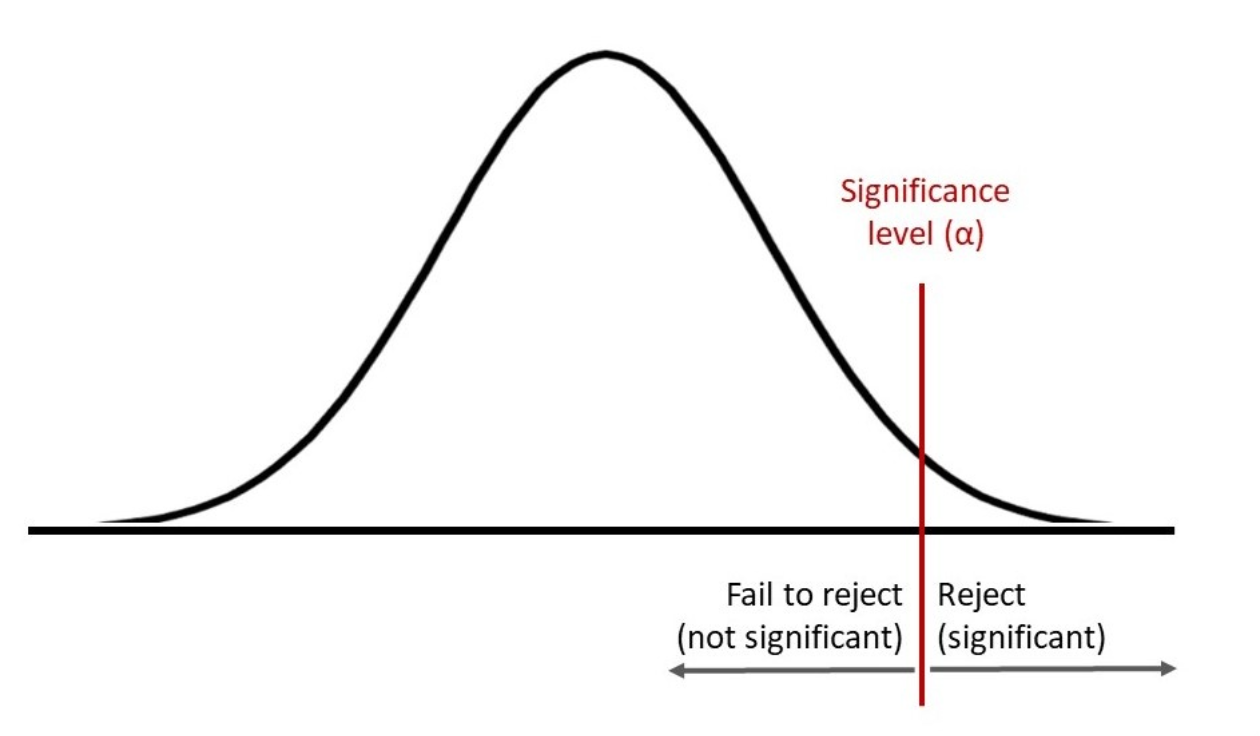
The Significance Level (often denoted as α) represents the probability of rejecting the null hypothesis when it is true.
A typical significance level in research is 0.05, which corresponds to a 5% chance of committing a Type I error. It is a crucial threshold in statistical inference that helps researchers determine the strength of their conclusions.
Central Limit Theorem
The Central Limit Theorem (CLT) is a fundamental concept that states that the distribution of the sample mean approximates a normal distribution as the sample size grows, regardless of the population's distribution.
P-Value
The P-Value is the probability of observing results as extreme as, or more extreme than, the observed results, given that the null hypothesis is true.
A small p-value (typically ≤ 0.05) indicates strong evidence against the null hypothesis.
Margin of Error
The Margin of Error represents the extent of error in sample estimates of a population parameter.
It provides a range within which the true parameter is expected to lie, commonly seen in survey data.
Sampling Distribution
A Sampling Distribution is the probability distribution of a statistic (like the sample mean) based on multiple samples from the same population.
It plays a central role in making inferences about the population parameter.
Standard Error
Standard Error (SE) measures the dispersion of sample statistics around the population parameter. It reflects how much the sample mean is expected to vary from the actual population mean.
Statistical Inference Techniques
Various inference in statistics techniques enable analysts to test hypotheses, estimate unknown parameters, and derive insights from data efficiently.
t-Tests
A t-Test is a type of statistical test used to compare the means of two groups. It helps determine if there is a significant difference between the groups by assessing the ratio of the difference in means to the variability within the groups.
Chi-Square Test
The Chi-Square Test is a statistical test used to examine the association between categorical variables.
It is often used in studies involving frequency data to test the independence of two variables.
Analysis of Variance (ANOVA)
ANOVA is a statistical method used to compare the means of three or more samples to understand if there are statistically significant differences among them. It is commonly used in experimental research.
Regression Analysis
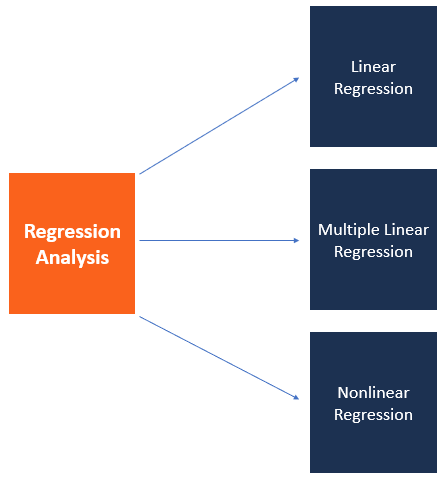
Regression Analysis is a statistical technique used to model and analyze the relationship between variables.
Inference in regression allows one to make predictions about one variable based on the value of another.
Z-Test
A Z-Test is used when comparing sample means, often when the sample size is large (n > 30).
It assumes that the data is normally distributed and the standard deviation of the population is known.
When is Statistical Inference Used?
Statistical inference comes into play in a variety of scenarios, often when conclusive data is not reachable. Let's explore some of these.
Market Research
Statistical inference helps industries improve their processes, increase productivity, or introduce better products based on consumer feedback.
Companies deploy statistical inference during market research to draw insights about their consumer base and understand market trends.
Quality Control
In quality control, random samples are taken, and statistical inference is used to conclude about the overall product quality.
Public Health Studies
In the healthcare sector, statistical inference plays a crucial role in designing public health policies, clinical trials, or detection of disease trends.
Public health researchers use statistical inference to study the impacts and prevalence of diseases, based on samples of affected individuals.
Social Research
Social research institutions use statistical inference to validate hypotheses, analyze results, and draw conclusions based on experimental or observational data.
Statistical inference aids in understanding societal trends, behaviors, or attitudes based on representative sample studies.
Economic Forecasting
Economists use statistical inference to make predictions about economic indicators like inflation, GDP growth rate, or unemployment levels.
Government Agencies
Government agencies rely on statistical inference for formulating policies, making future projections, or understanding the impact of existing plans on the population.
Government bodies utilize statistical inference for policymaking, program evaluation, or demographic forecasting.
Universities
In universities, statistical inference forms a part of the curriculum across varying departments like psychology, sociology, economics, biology, etc., and also aids in research conducted.
Best Practices for Statistical Inference
Making the right inferences from data is critical to any statistical analysis or machine learning model. Below are best practices for statistical inference:
- Hypothesis Testing: Statistical inference often involves making decisions or predictions based on data. Hypothesis testing is a process where an assumption about a population parameter is first assumed. The assumptions are then tested based on sample data.
- Select Appropriate Test Statistic: Depending on the type of data, the nature of the distribution, and our question of interest, it is essential to choose the right statistical test.
- Check for Assumptions: Before conducting statistical inference, we should check for the assumptions needed for a particular statistical test, such as independence, normality, or equal variances.
- Control for Multiple Testing: If you are testing multiple hypotheses simultaneously, be sure to account for multiple tests by adjusting your significance level or using techniques such as Bonferroni correction.
- Use Confidence intervals: Instead of hypothesis testing, sometimes a confidence interval estimation can be more informative.
Confidence intervals give us a range of plausible values for our parameter of interest.
Challenges with Statistical Inference
Despite its vast potential, there are several challenges associated with statistical inference:
- Misinterpretation: Common misunderstandings in statistical inference include confusing statistical significance with practical importance, misinterpreting p values, and misunderstanding confidence intervals.
- Data Issues: Data quality and appropriateness are always a concern. These can include bias in data collection, insufficient sample size, or data that is not representative of the population.
- Overfitting: While building statistical models, overfitting remains a challenge. Models may become so complex that they fit the idiosyncrasies of the data in the sample, but fail to generalize to new, unseen data.
- Reproducibility Crisis: A present debate in the scientific community is the reproducibility crisis of statistical inferences. Many scientific studies are difficult or impossible to reproduce, leading to questions about the validity of the findings.
Recent Trends in Statistical Inference
Modern developments in inference in statistics incorporate big data and AI, enhancing the precision and scope of statistical analysis across fields.
So, let's look at a couple of recent trends emerging in the field of statistical inference.
Bayesian Statistics

Bayesian statistics, an alternative to the traditional frequentist approach, is witnessing a growing application.
It incorporates software prior knowledge into the inferential process which can sometimes lead to more intuitive results.
Robust Inference
Robust statistical methods that can provide reliable results even under violation of assumptions are gaining traction.
Machine Learning

The cross-pollination between machine learning and statistical inference is increasingly happening.
Machine learning algorithms can help achieve statistical inference at a scale and complexity that traditional methods might struggle with.
Causal Inference
Causal inference — statistical methods designed to infer causal relationships from data — is seeing increased interest in fields from health science to machine learning.
Bootstrap Inference
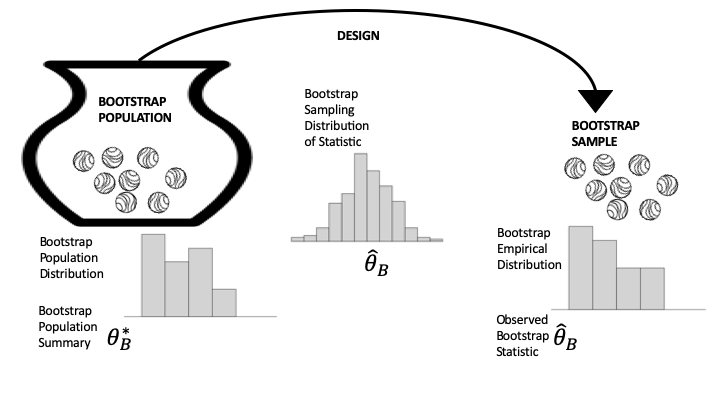
Once a computationally expensive option, bootstrap methods for statistical inference, which rely on resampling data to estimate sampling distribution, have become increasingly viable with better computing power.
Point Estimation
Point Estimation involves using sample data to provide a single best guess (point estimate) of a population parameter. Common point estimates include sample mean (for population mean) and sample proportion (for population proportion).
Interval Estimation
Unlike point estimation, Interval Estimation provides a range within which the parameter is expected to lie. This approach helps account for the variability inherent in sampling and adds a degree of certainty to estimations.
Frequently Asked Questions (FAQs)
What differentiates descriptive statistics from Statistical Inference?
While descriptive statistics summarize and analyze data collected from a sample, statistical inference goes beyond making predictions or assumptions about the population from the sample data.
How do confidence intervals contribute to Statistical Inference?
Confidence intervals provide an estimated range of values within which the population parameter is likely to fall, hence enabling the extraction of meaningful insight about the population from the sample.
What role does hypothesis testing play in Statistical Inference?
Hypothesis testing, a key part of statistical inference, helps in making decisions about population parameters based on sampled data. It helps in validating the claims made about the population.
How does sample size impact Statistical Inference?
A larger sample size can lead to more accurate inferences as it better represents the population. A smaller sample size, in contrast, may lead to less accurate results and potential biases.
Are Statistical Inference methods used in Machine Learning?
Yes, statistical inference methods are utilized in machine learning. They help improve the accuracy of predictions by enabling assumptions about the unknown population characteristics based on available data.
