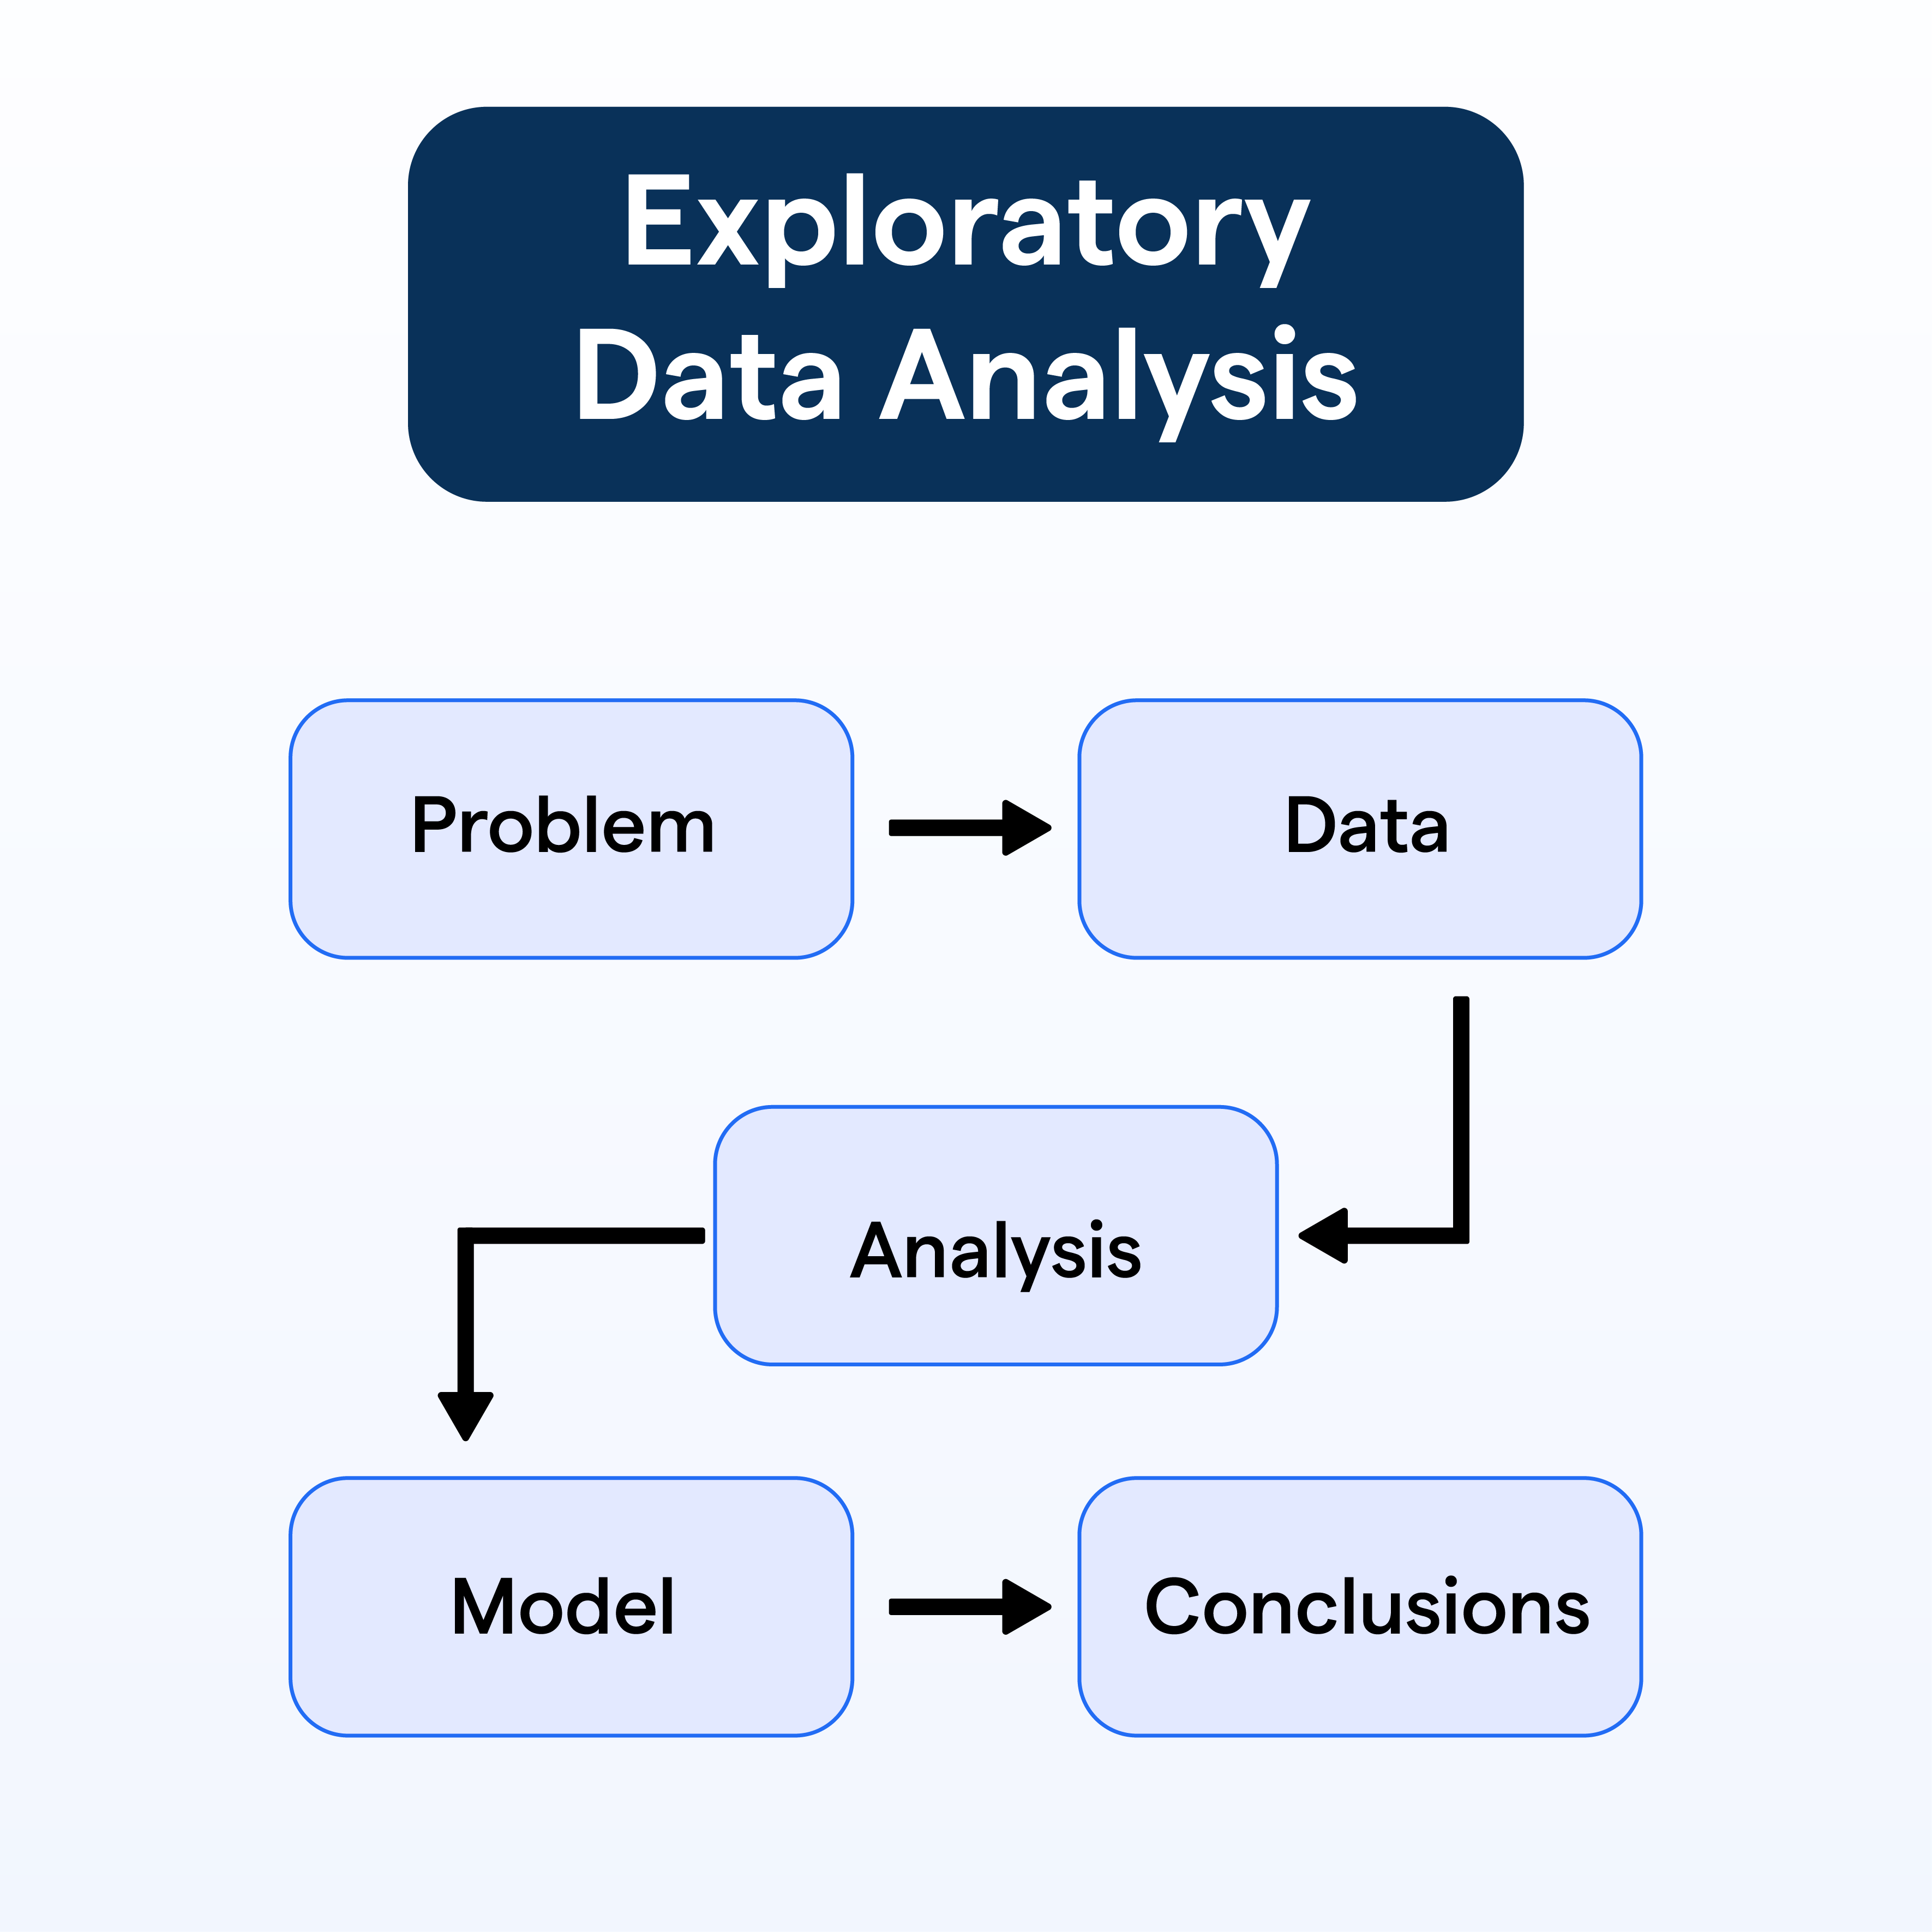
What is Exploratory Data Analysis?
Exploratory Data Analysis is an approach to data analysis outlining features of the data, testing assumptions, and checking for anomalies before formal modeling. It's about visualizing, summarizing and interpreting the information hidden in rows and columns of data.
Understanding Through an Analogy
Consider EDA as a detective's initial investigation at the crime scene, collecting evidence and learning about the scenario before proposing any theories.
Role in Data Science
In data science, EDA is a preliminary step where the data scientist explores data to gain insights, add context, and select appropriate models.
Basis of Exploratory Data Analysis
Exploratory Data Analysis is based on two principles: Every dataset is a unique story, and newer narratives and subplots can be found with deeper exploration.
EDA versus Confirmatory Data Analysis
While EDA seeks to explore and find out what the data can tell us, Confirmatory Data Analysis (CDA) is the formal testing of pre-specified hypotheses.
Why is Exploratory Data Analysis Crucial?

Now that we have a sense of what EDA is, let's discuss why it is important.
Foundation for Model Building
EDA plays a crucial role in understanding the nuances of data, facilitating effective model selection and hypothesis generation.
Anomaly Detection
EDA helps in identifying anomalies and outliers in the data, which could influence the eventual analytical model's performance.
Ensuring Validity of Data and Assumptions
EDA ensures that the data under analysis is valid, data collection was done correctly, and various statistical assumptions related to the data are tested.
Guiding the Selection of Statistical Tools
EDA assists in selecting appropriate statistical tools and techniques for data analysis.
Improving the Interpretability of Results
By uncovering trends, patterns, and relationships in data, EDA improves the interpretability of the eventual analytical results.
Who Uses Exploratory Data Analysis?
Understanding who uses EDA can further clarify its importance. Let's check a few key players.
Data Scientists
Data scientists extensively use EDA as part of their data preprocessing workflow.
Statisticians
Statisticians use EDA to examine data for potential patterns, trends, errors, and to formulate hypotheses.
Business Analysts
Business analysts rely on EDA to gain a keen understanding of business data and develop insightful reports.
Market Researchers
Market Researchers use EDA to dive into consumer data to unveil hidden patterns and perceptions.
Students and Academics
EDA is a crucial part of the curriculum for students studying statistics, data science, and related fields. Academics use it for data-led research.
When is Exploratory Data Analysis Performed?
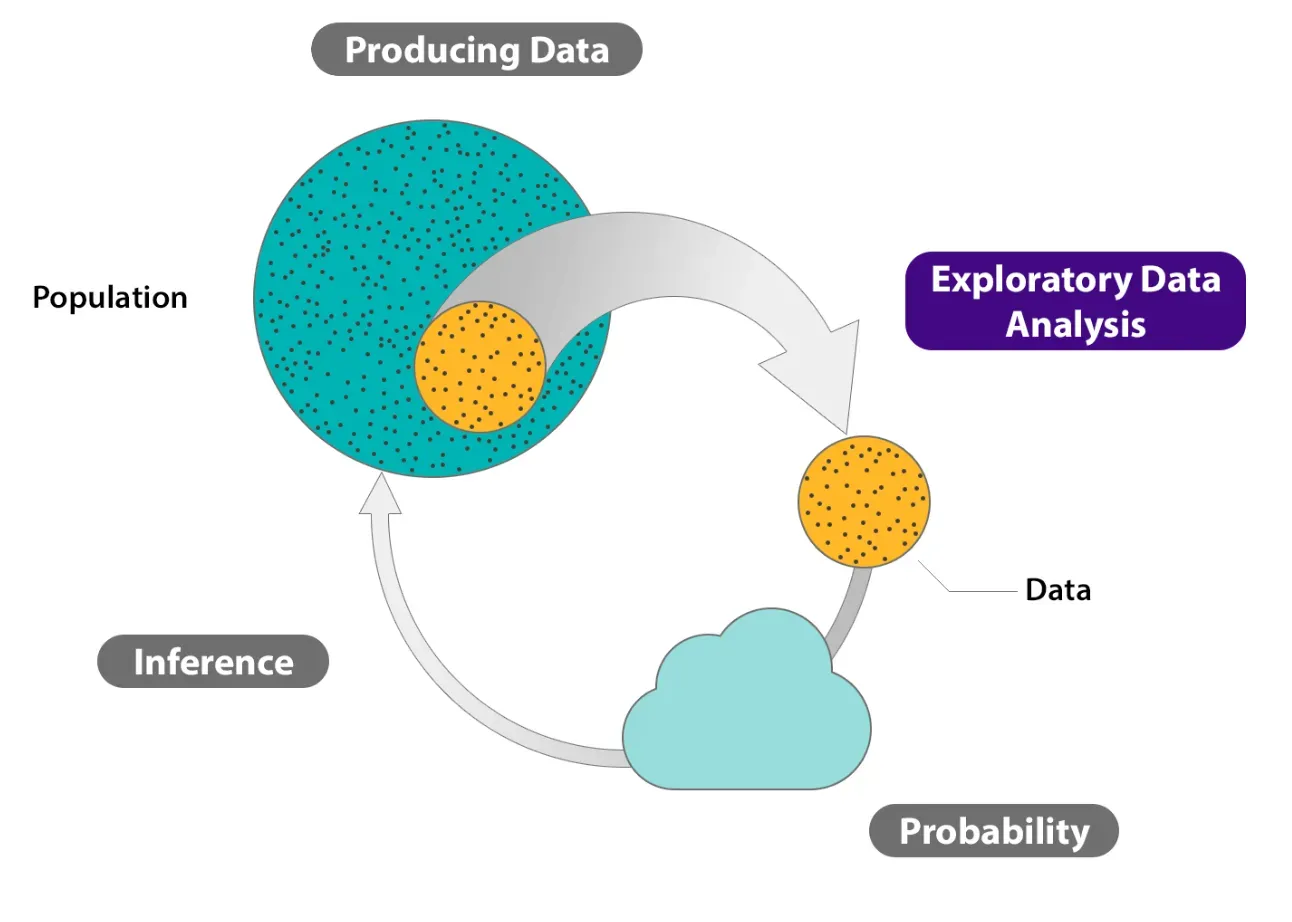
To comprehend EDA fully, we need to understand when it's performed in the overall data analysis workflow.
Initial Stage of Data Analysis
EDA is typically performed at the initial stages of data analysis. It helps analysts get familiarized with the data at hand.
Pre-Model Building Stage
Before the decision of choosing a model is made, EDA is carried out to understand the characteristics of the data.
During Data Cleaning
EDA is performed during data cleaning to identify and address issues like outliers, missing data, and inconsistencies.
Post Data Collection
Once data collection is completed, EDA is used to examine the collected data in detail.
Pre Hypothesis Testing
Before performing hypothesis testing and building predictive models, EDA takes the center stage.
Where is Exploratory Data Analysis Applied?
Now, let's explore some key areas where EDA comes into play.
Healthcare
In the healthcare domain, EDA is used to analyze patient data, disease outbreaks, drug effectiveness, and more.
E-commerce
E-commerce businesses employ EDA to analyze customer shopping patterns and make effective recommendations.
Finance
Financial institutions apply EDA to identify trends and patterns in financial markets.
Sports Analytics
EDA has a foothold in sports analytics, where it provides insights into player performance, team dynamics, and game strategy.
Social Media Analysis
In the realm of social media, EDA is employed to understand user behavior, trends, and interactive patterns.
How is Exploratory Data Analysis Carried Out?
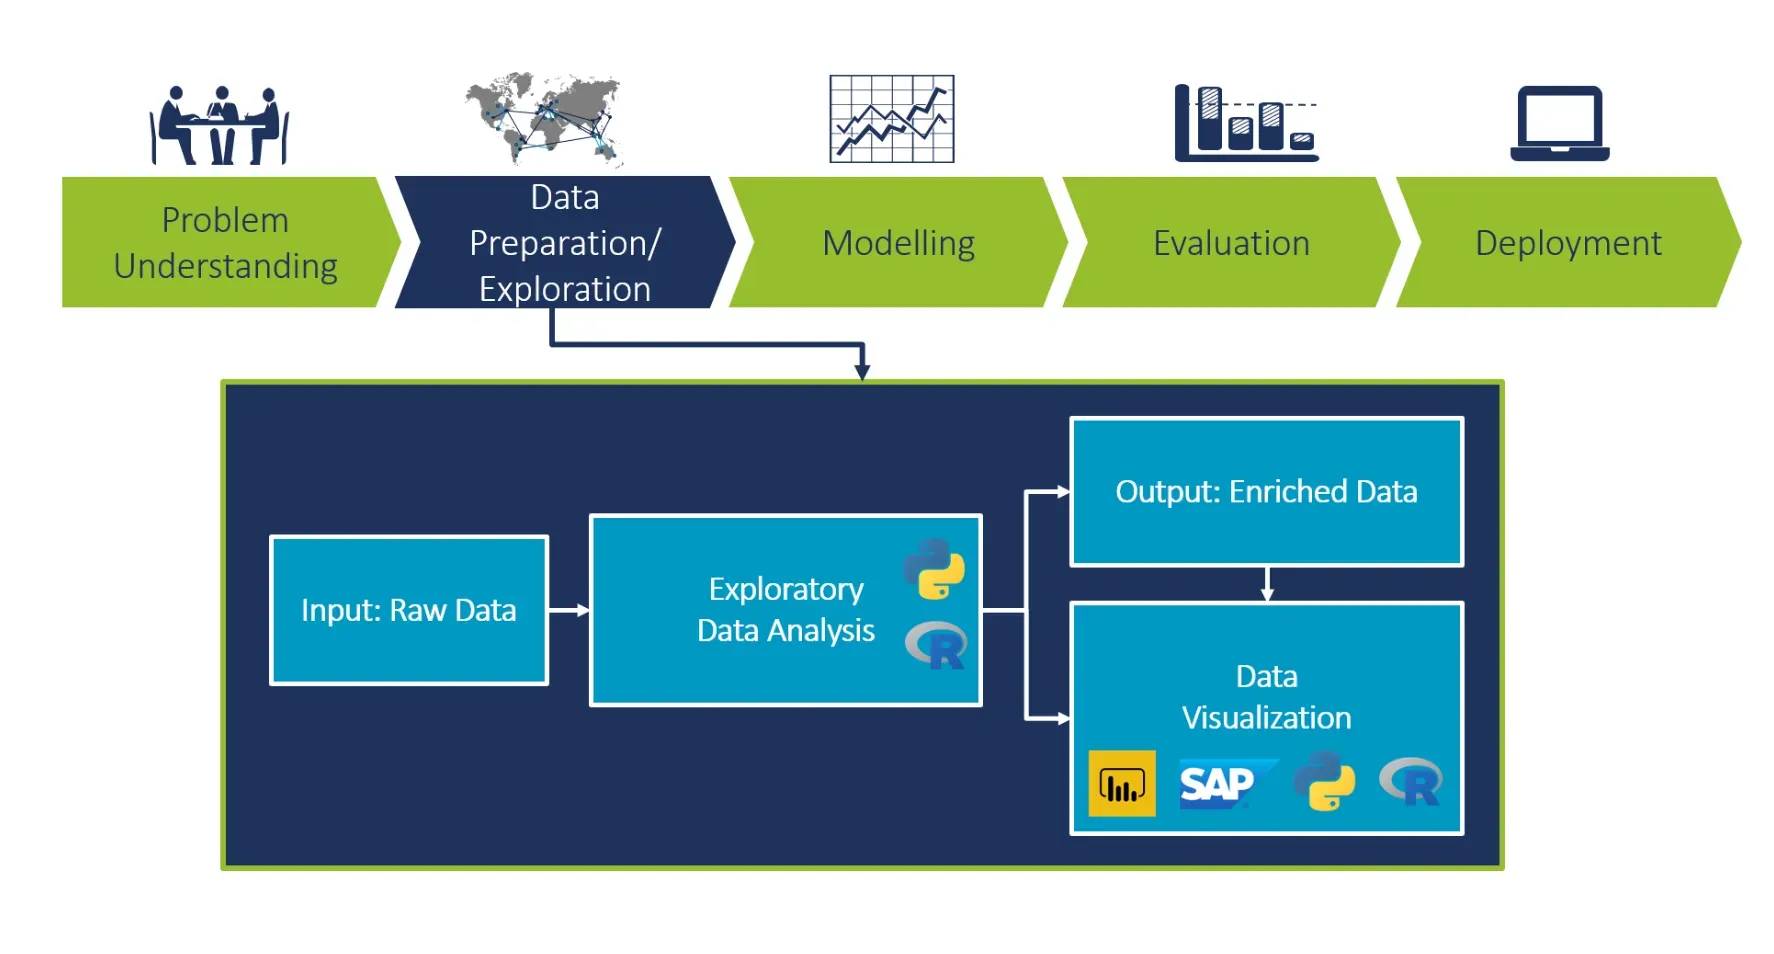
So, how do we do EDA? Let's explore the process.
Data Collection
EDA begins with raw data being collected from various sources and prepped for analysis.
Data Cleaning
To ensure valid results, data cleaning is done to deal with errors, missing values, duplicates, etc.
Data Transformation
Data is then transformed into a suitable format for analysis, involving normalization, aggregation, etc.
Descriptive Statistics
Descriptive statistics are calculated, which summarize the data, including trends, dispersion, and central tendency.
Visualization
Finally, data is visualized using charts, graphs and tables to aid in understanding and interpreting results.
Core Principles of Exploratory Data Analysis
Having understood how EDA is performed, we should know the foundational principles guiding it.
Examine All Variables Independently
Each variable in the dataset should be examined independently using summaries and visualizations.
Check for Anomalies
Identify and deal with anomalies such as outliers and missing values in the dataset.
Plotting Data for Insights
Graphics play an essential role in EDA as they facilitate understanding of the data.
Investigate Complex Relationships
Examine relationships between variables to get valuable insights into correlations and dependencies.
Test Assumptions
To avoid pitfalls later on, test assumptions about relationships and distribution of the variables.
Techniques used in Exploratory Data Analysis
Let's now engage with various techniques popularly used in EDA.
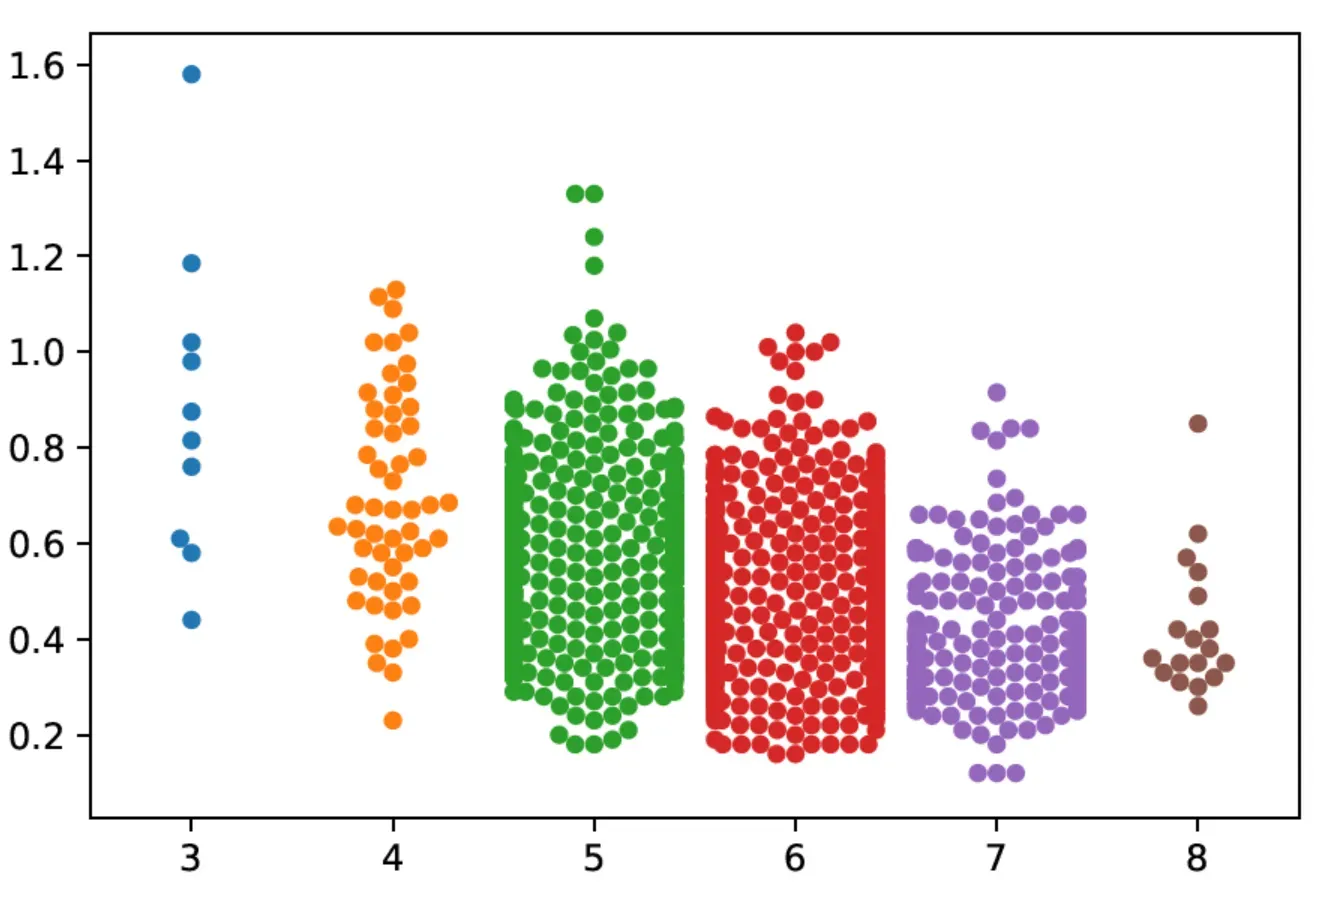
Univariate Analysis
Univariate analysis involves the detailed exploration of one variable at a time.
Bivariate Analysis
Bivariate analysis delves into the relationship between two variables to identify patterns, correlations, or causality.
Multivariate Analysis
Multivariate analysis examines complex patterns and relationships involving more than two variables.
Data Visualization
Visualizing data through charts and graphs is a powerful and common technique in EDA.
Descriptive Statistics
Descriptive statistics include measures like mean, median, mode, standard deviation, and others that summarize key features of the data.
Limitations and Challenges of Exploratory Data Analysis
Despite EDA's significance, there exist some limitations and challenges.
Time-Consuming
EDA can be labor-intensive and time-consuming due to its exploratory nature.
Influence of Preconceived Notions
Analysts' personal biases can influence the process and lead to misleading results.
Handling of Large Datasets
Managing large datasets in EDA can be challenging and requires specialized techniques and powerful computing resources.
Difficulty in Choosing Appropriate Plots
Choosing the right visual representation method is critical and can be difficult, especially in complex multivariate analysis.
Dependent on Analyst's Skills
The success of EDA is highly dependent on the skills and creativity of the analyst.
Trends and Future of Exploratory Data Analysis
In conclusion, let's look at some popular trends and the future of EDA.
Integration with Machine Learning
The emerging trend is integrating EDA with machine learning to automate portions of the process and handle big data more efficiently.
Advancements in Data Visualization Tools
Data visualization tools are becoming more advanced, providing more capabilities for EDA.
Importance in AI Solutions
EDA is gaining importance in the development of AI solutions due to the need for understanding and interpreting models.
Emphasis on Real-time EDA
There's an increasing emphasis on real-time EDA allowing immediate exploration and understanding of streaming data.
Requirement in Data-Driven Decision Making
As organizations rely more on data-driven decision making, EDA is becoming a key component in the process.
Best Practices for Exploratory Data Analysis
To carry out an effective Exploratory Data Analysis (EDA), several best practices should be adhered to:
- Set clear objectives: Start EDA with a clear understanding of the goals and objectives to avoid aimless exploration.
- Understand your data: Get familiar with the data, understand the variables, the data types, and the overall structure.
- Consistent naming conventions: Stick to a consistent naming convention for variables and columns to prevent confusion.
- Collaborate with domain experts: Consult domain experts to add context and validate the findings derived from the data.
- Handle missing values: Consider imputing missing values or removing observations with missing values based on the context and the proportion of missing data.
- Identify and treat outliers: Detect outliers using visualization techniques or descriptive statistics and decide how to treat them.
- Feature engineering: Create new variables by combining, transforming, or aggregating existing variables when appropriate.
- Validate assumptions: Check the assumptions related to the data and the statistical methods applied.
- Choose appropriate visualization techniques: Use the most suitable visualization methods for the type of data being analyzed.
- Document insights and findings: Keep track of your observations, insights, and any changes made to the data as you progress through EDA.
Frequently Asked Questions (FAQs)
What is the Primary Objective of Exploratory Data Analysis (EDA)?
The primary objective of EDA is to understand the patterns and relationships in data. It allows data analysts to identify anomalies, test assumptions, and devise hypotheses for subsequent statistical testing.
How Does EDA Differ from Traditional Data Analysis?
Unlike traditional data analysis, which involves hypothesis testing and model building, EDA prioritizes discovering patterns and relationships in the dataset. It’s a process meant to generate insights and form new hypotheses.
Can EDA Help Manage Missing or Irregular Data?
Yes, EDA can help identify missing or irregular data. Techniques like visualization or summary statistics can spotlight inconsistencies, outliers, or missing data, informing subsequent data cleaning and preparation steps.
What Role Does Visualization Play in EDA?
Visualization is a powerful tool in EDA. It helps in identifying trends, patterns, and outliers, interpreting complex datasets. Plotting data can help in understanding distributions, correlations, and the effect of different variables.
What is the Value of EDA in Machine Learning?
Exploratory Data Analysis provides valuable input for Machine Learning. By comprehending the underlying structure of data, EDA aids in choosing suitable ML algorithms, fine-tuning model parameters, and improving model performance.
