


.webp)
How to Use Google Analytics for Chatbots to Track Conversations
Updated at May 4, 2026
12 min to read
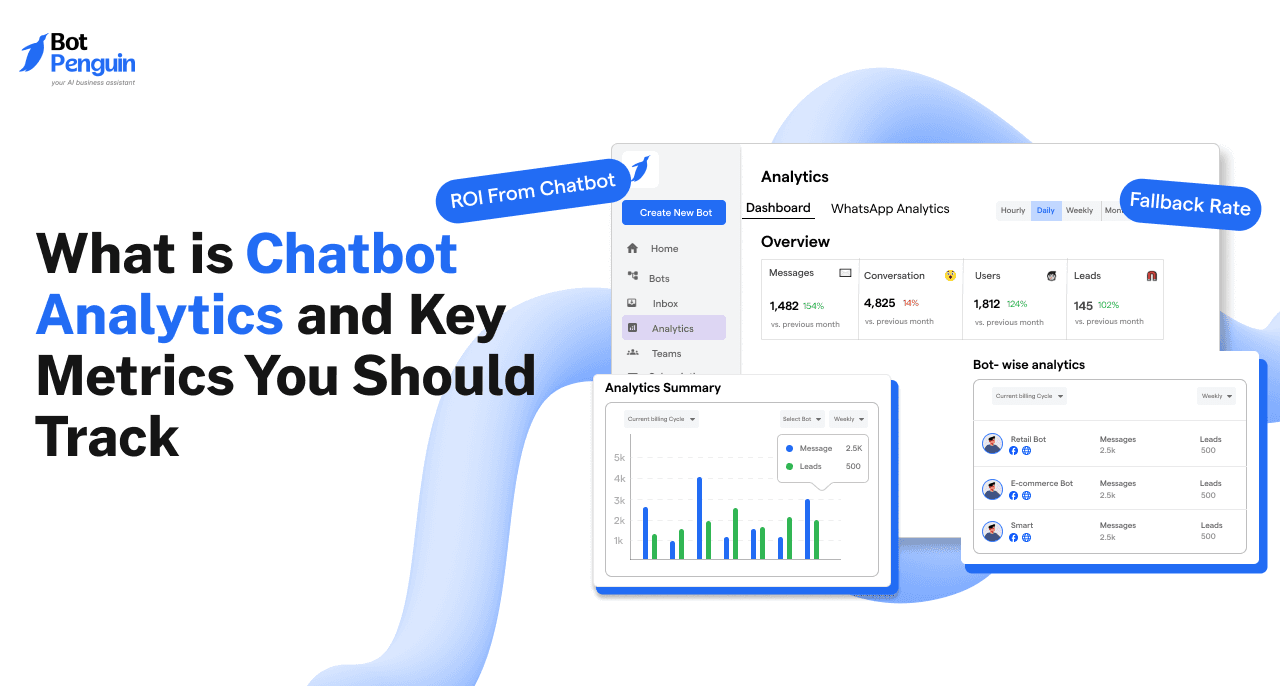
Chatbots don’t just talk; they leave a trail.
Every message, question, and click is data. Most businesses ignore it. But this data holds the secret to why your chatbot succeeds—or fails. Imagine knowing exactly why users stop mid-conversation or why some never come back.
That’s where chatbot analytics comes in. It’s not about guessing what works. It’s about tracking, understanding, and improving.
In this guide, we’ll break down chatbot analytics and explore 12 key metrics you need to track. These metrics will help you unlock your chatbot’s full potential and deliver better results for your business.
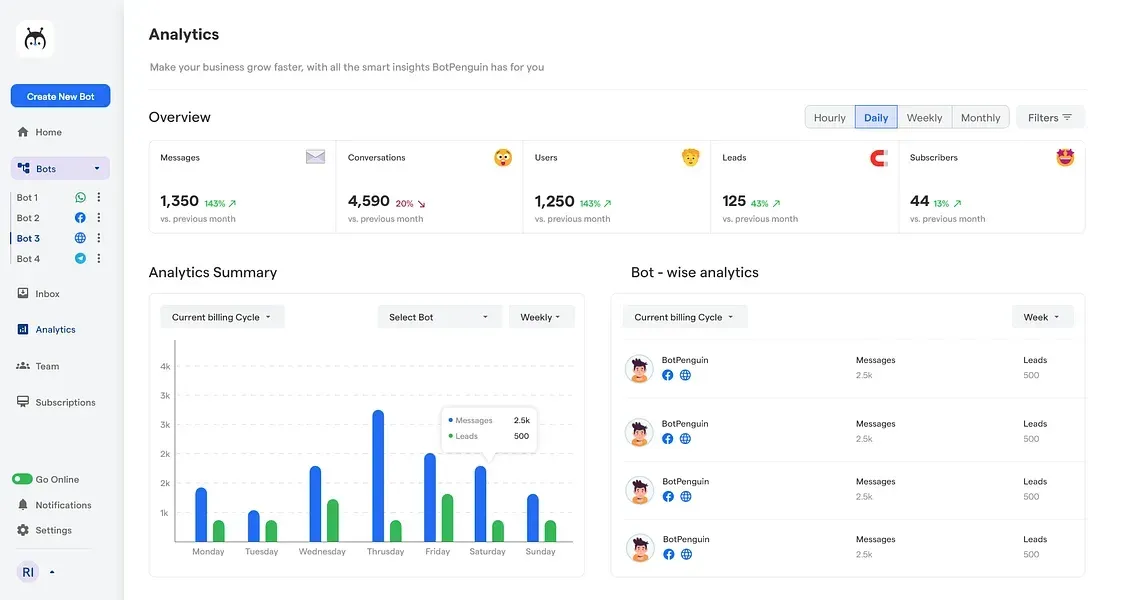
Chatbot analytics is the process of tracking, measuring, and analyzing the performance of a chatbot. It helps you understand how users interact with the bot, whether it meets their needs, and where it can be improved.
Imagine running a restaurant chatbot. You notice many users start a conversation but drop off before making a reservation. Without chatbot data analytics, you’d never know that your chatbot asks for too much information upfront, frustrating users. With analytics, you can spot this issue and simplify the process to boost completion rates.
AI chatbot analytics doesn’t just measure numbers. It provides insights into user intent, sentiment, and satisfaction. For example, you can see if users are confused by a particular question or if they’re satisfied with your responses. This level of detail helps businesses optimize their analytics chatbot to serve customers better.
By focusing on chatbot analytics, you ensure your chatbot evolves to meet user needs, increasing efficiency and customer satisfaction.
Good chatbot data analytics doesn’t just fix chatbot issues—it transforms business operations. By analyzing user interactions, businesses can streamline processes, reduce costs, and boost efficiency.
Take an e-commerce store that receives thousands of customer queries daily. Their chatbot handles common questions like order tracking or refund policies. If AI chatbot analytics reveals that 30% of queries require human intervention, it’s a sign to train the chatbot on those topics.
This not only reduces the workload for customer support teams but also delivers faster responses to customers, improving satisfaction.
A lead generation chatbot can provide insights into user behavior across the sales funnel. Let’s say the analytics shows users drop off during payment inquiries. This may indicate confusion around pricing or payment options. Addressing this issue directly through chatbot updates can recover lost leads and increase conversions.
For internal chatbots used in HR or IT support, analytics chatbot tools reveal repetitive queries or tasks. If employees repeatedly ask about leave policies, the business could create a self-service feature. This reduces reliance on HR staff and improves productivity across teams.
One real-world example is a banking chatbot that handles account balance inquiries. By analyzing data trends, the bank might discover that users often ask about loan eligibility immediately after checking balances. This insight can help the bank preemptively display loan offers, increasing cross-sell opportunities.

Tracking chatbot metrics effectively requires a structured approach. With the right tools and strategies, you can monitor key chatbot analytics and continuously improve your bot’s performance. Here are the steps:
To make your chatbot truly effective, you need to track key metrics. These metrics don’t just provide numbers—they help you uncover hidden issues and guide improvements. Below are four crucial chatbot metrics you should monitor. Each offers actionable insights and real-world use cases across industries.
In Chatbot analytics, the Lead generation rate measures how often users share their information, such as email addresses or phone numbers, through your chatbot. It indicates how well the chatbot engages users and encourages them to become leads.
For instance, a real estate chatbot might ask, “Would you like a brochure? Share your email.” If many users agree, the chatbot effectively captures potential customers. A low rate could signal a poorly designed conversation flow or lack of compelling calls-to-action.
If your chatbot analytics metrics show a low lead generation rate, revise your bot’s scripts to include more engaging questions. For example, offering incentives like discounts or exclusive content can encourage users to share their details.

This metric of chatbot analytics identifies the most frequently selected responses or paths in the chatbot’s predefined conversation flow. It shows what users find most useful or relevant.
For example, if the majority of users choose “Track My Order” in an e-commerce chatbot, this reveals a demand for delivery-related updates. On the other hand, rarely chosen options might indicate unnecessary complexity in the chatbot flow.
Optimize your chatbot based on popular choices. For instance, if users often select “Schedule an Appointment,” make this option more accessible, such as through quick reply buttons or pinned menus. Remove underused options or merge them with more relevant choices to streamline the experience.
Tracking these patterns using chatbot analytics ensures your bot aligns with user priorities, enhancing its overall effectiveness.
Resolution time measures how quickly the chatbot resolves a user’s query or completes a task. It highlights the efficiency of the bot in meeting user needs.
For example, if a banking chatbot takes several messages to confirm a simple transaction, this indicates inefficiency. On the other hand, a swift resolution, such as a chatbot immediately providing account balances, enhances the user experience.
If your chatbot performance metrics reveal high resolution times, simplify workflows. For instance, reduce the number of steps needed to complete tasks, like processing refunds or scheduling appointments. You can also enhance the bot’s knowledge base with clearer, more direct answers to common queries.
BotPenguin’s chatbot analytics dashboard can help you monitor and reduce resolution times by identifying bottlenecks in your bot’s flow.

Frequent queries refer to the questions or concerns users bring up most often in their interactions with your chatbot. This metric highlights recurring issues, pain points, or information gaps.
For example, a software company’s chatbot might see frequent questions like “How do I reset my password?” This could indicate a confusing login process or insufficient self-service options.
Analyze frequent queries to improve your bot’s responses or address underlying issues. For example, if many users ask about shipping costs, consider displaying this information prominently on your website. Alternatively, add quick replies or FAQ sections to preemptively answer these questions.
Total sessions measure the number of interactions initiated with your chatbot over a specific period. Each session starts when a user begins a conversation and ends when the chat is closed or idle for a certain duration. This chatbot analytics metric highlights the overall usage of your chatbot, indicating its visibility, reach, and relevance to your audience.
For instance, a chatbot for a retail website might have high session counts during festive sales, reflecting increased customer engagement. Conversely, consistent low session counts could mean your chatbot isn’t being noticed or isn’t relevant enough to users.
A drop in total sessions might indicate declining user interest or poor visibility of the chatbot on your platform. For example, if your chatbot analytics metrics show low session counts, try placing the chatbot widget in more prominent areas like product pages or the FAQ section.
Increasing sessions could mean users are finding the bot helpful, allowing you to double down on its most-used features. For example, an airline chatbot could add quick links for booking or check-ins if those queries drive most sessions.
In chatbot analytics Unique users represent the number of distinct individuals interacting with your chatbot during a specified time frame. Unlike total sessions, which can count multiple interactions by the same user, this metric gives a clearer picture of how many people your chatbot is actually reaching.
For example, a chatbot on a fitness app may have hundreds of sessions in a day but only 50 unique users, meaning each user interacted with the bot multiple times. Monitoring unique users helps you understand your chatbot’s reach and popularity among your target audience.
If your chatbot KPI metrics show a low number of unique users, consider promoting the chatbot through newsletters, social media, or website banners. For example, a fitness app could highlight the bot’s ability to provide personalized workout recommendations.
Conversely, an increase in unique users signals growing awareness or popularity. Use this data to analyze what draws new users. For example, a retail business might find that a chatbot offering personalized product suggestions is attracting more customers.
Message count refers to the total number of messages exchanged between users and your chatbot during a session. This includes both user messages and chatbot responses. It measures interaction depth and user engagement, showing how active conversations are.
For example, if a chatbot for tech support handles an average of 10 messages per session, it indicates users are asking detailed questions or troubleshooting issues step by step. A lower message count might mean users are dropping off early or finding the responses unhelpful.
A low message count may indicate users are not fully engaging or abandoning conversations. Use chatbot analytics to identify where users drop off. For instance, if a chatbot for a tech company frequently gets stuck during troubleshooting steps, simplify the flow to encourage users to complete the conversation.
A high message count in chatbot analytics might suggest users are finding value in the chatbot or that the bot’s flow is too complex. In the latter case, streamline responses to make interactions more efficient.
Resolution rate measures the percentage of queries that the chatbot resolves successfully without human intervention. It reflects the chatbot’s ability to handle user needs effectively. A high resolution rate indicates a well-functioning bot, while a low rate could signal gaps in the bot’s knowledge base or flow.
For example, a chatbot on a healthcare website may resolve 70% of appointment scheduling queries without escalation to a human agent. This would indicate that users are getting their needs met quickly and efficiently. However, frequent escalation to agents for the same issue could mean the bot’s response needs updating.
If your chatbot analytics metrics reveal a low resolution rate, identify common issues requiring escalation. For example, a SaaS business might find that billing questions are frequently escalated. Adding detailed answers or payment guides can boost the resolution rate.
High resolution rates demonstrate chatbot efficiency. Use these insights to automate additional workflows. For example, a healthcare chatbot with a high resolution rate for appointment scheduling could also handle prescription refill requests.

The fallback rate measures how often a chatbot fails to understand or respond to a user’s input. It tracks instances where the bot responds with phrases like “I didn’t understand that.” A high fallback rate indicates gaps in the bot’s training or understanding of user intent.
For example, a customer might ask, “What’s your return policy?” If the bot replies with “I’m not sure I can help with that,” it reflects a missed opportunity to assist.
If your chatbot analytics metrics show a high fallback rate, review the bot’s training data to identify missed intents. Expand the bot’s knowledge base to cover common variations of user queries. For instance, in an e-commerce setting, if “refund process” is often misunderstood, add related keywords and responses.
CSAT measures customer satisfaction with the chatbot’s performance. It is typically collected through post-interaction surveys, asking users to rate their experience. A low CSAT score indicates poor user satisfaction, often due to unhelpful responses or unresolved issues.
For example, after resolving a query, a bot might ask, “How satisfied are you with this experience?” If most users rate it poorly, the bot’s effectiveness is likely lacking.
Analyze low CSAT scores to identify patterns. If users frequently express dissatisfaction with certain workflows, refine those areas. For instance, a telecom chatbot could add more detailed responses to billing queries if users find the current information unclear.
The human handoff rate measures how often a chatbot escalates conversations to human agents. While some handoffs are necessary, a high rate could indicate that the bot isn’t equipped to handle complex queries or resolve issues independently.
For example, if a banking chatbot transfers all technical support queries to an agent, it suggests the bot needs better training in this area.
Monitor handoff patterns to determine which queries require escalation. If repetitive questions like “How do I reset my password?” are frequently handed off, update the bot’s responses to handle these independently. Reduce handoff rates by training the bot to manage more complex scenarios.
ROI (Return on Investment) measures the financial benefits derived from your chatbot compared to its cost. It evaluates how well the bot contributes to revenue, cost savings, or operational efficiency.
For example, an e-commerce chatbot that handles customer queries without requiring human agents saves time and money. Additionally, if the bot increases sales by recommending products, it directly boosts ROI.
Calculate ROI by comparing chatbot expenses (development, maintenance) against measurable benefits like reduced support costs or increased conversions. For instance, a retail business might use chatbot performance metrics to show that automated customer support reduced the need for extra staff during peak seasons.
By leveraging tools like BotPenguin’s chatbot analytics metrics, businesses can clearly evaluate ROI and optimize their bot for maximum efficiency.
Understanding and utilizing chatbot analytics is vital for making your chatbot smarter and more effective. By monitoring the 12 key metrics discussed in this blog, you can improve user satisfaction, reduce inefficiencies, and drive better outcomes for your business. Whether it’s tracking fallback rate, analyzing CSAT scores, or calculating ROI, these metrics provide actionable insights to fine-tune your bot’s performance.
If you’re already using a chatbot platform, you might wonder if you’re leveraging analytics to their fullest potential. Are you able to track all these metrics seamlessly across multiple platforms? That’s where BotPenguin steps in.
As an omnichannel chatbot platform, BotPenguin brings all your chatbot analytics—whether for your website, WhatsApp, or Messenger—into one centralized dashboard. It not only tracks all 12 metrics mentioned but also provides deeper insights for specific platforms, like WhatsApp, with features such as message read and delivery rates. With BotPenguin, managing and optimizing your chatbot strategy becomes effortless, helping you stay ahead of the curve and drive measurable success.
Chatbot metrics help identify strengths, weaknesses, and opportunities for improvement. They ensure your chatbot aligns with business goals, reduces inefficiencies, and delivers value to users by analyzing data like user engagement, resolution times, and conversion rates.
Essential metrics include fallback rate, CSAT, human handoff rate, resolution time, and ROI. These metrics highlight user satisfaction, efficiency, and areas needing optimization for improving the chatbot’s performance and achieving business objectives.
Monitoring fallback rate helps identify gaps in the chatbot’s understanding of user queries. Reducing it through better training or updated conversation flows ensures smoother interactions and a more helpful user experience.
ROI measures the financial benefits from a chatbot, comparing cost savings (e.g., reduced support tickets) and revenue generation (e.g., upselling) against chatbot expenses. It’s a key metric for evaluating chatbot success.
Platforms like BotPenguin provide comprehensive dashboards for tracking metrics such as fallback rate, CSAT, and ROI across channels like websites, WhatsApp, and Messenger, ensuring seamless performance evaluation.
Subscribe to Our Newsletter
Get the latest business insights straight into your inbox.
Checkout our related blogs you will love.
Updated at May 4, 2026
12 min to read
Updated at Oct 6, 2026
12 min to read
.webp)
Updated at Oct 6, 2026
15 min to read

Updated at Oct 6, 2026
15 min to read
Updated at Oct 5, 2026
8 min to read
Updated at Sep 30, 2026
9 min to read
Table of Contents