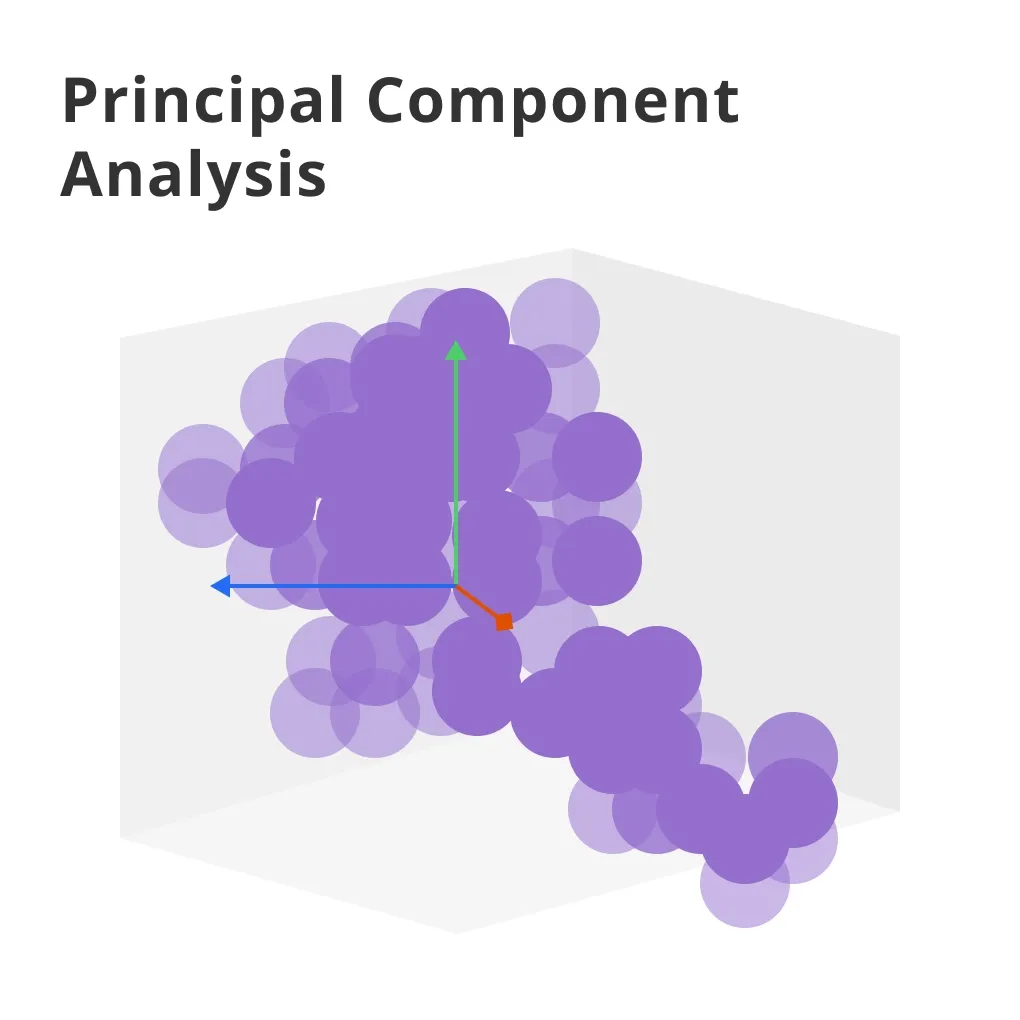
What is Principal Component Analysis?
Principal Component Analysis is a statistical procedure that uses an orthogonal transformation to convert a set of observations of possibly correlated variables into a set of values of linearly uncorrelated variables called principal components.
Goal
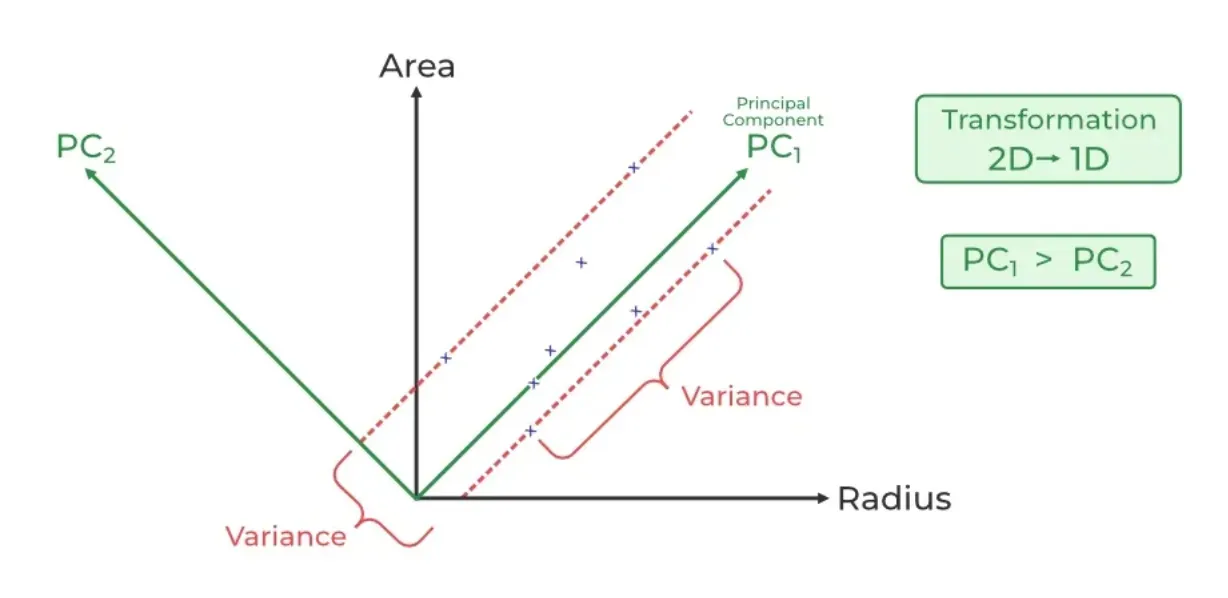
The main goal of PCA is to simplify the complexity of high-dimensional data while retaining trends and patterns.
How It Works
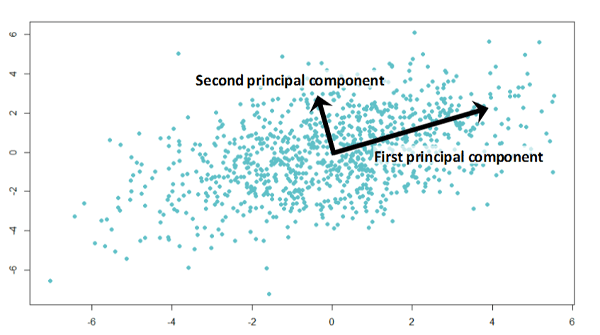
PCA identifies the axis that maximizes the variance of the data and projects it onto a new subspace with equal or fewer dimensions than the original data.
Use Cases
From image processing to market research and gene expression studies, PCA helps in reducing dimensions, thereby simplifying the analysis.
Importance
In the era of big data, PCA is invaluable for making data analysis tractable by reducing the number of variables under consideration, without losing the essence of the original dataset.
Who Uses Principal Component Analysis?
Understanding who benefits from using PCA can give you an idea of its wide-ranging applicability.
Data Scientists and Analysts
These professionals use PCA for exploratory data analysis and to speed up machine learning algorithms.
Academics and Researchers
In fields ranging from psychology to genomics, PCA helps simplify complex datasets to identify patterns and relationships.
Finance Professionals
PCA is used in portfolio management and risk management to identify diversification strategies.
Marketers
Market segmentation and customer insight analysis often leverage PCA to identify distinct customer groups and preferences.
Engineers
PCA can reduce the dimensionality of control systems, making them more manageable and easier to analyze.
When to Use Principal Component Analysis?
Knowing when to deploy PCA can save you a lot of headaches by simplifying your data analysis process.
High Dimensionality
When your dataset has too many variables, making it hard to visualize or find relationships.
Multicollinearity
When variables in your dataset are highly correlated, PCA can help by creating new variables (principal components) that are linearly uncorrelated.
Data Compression
When you need to compress your data for easier storage or faster computation without losing critical information.
Pattern Recognition
PCA can help uncover hidden patterns in data, which may not be observable in the original dimensions.
Preprocessing for Machine Learning
PCA is often used to simplify datasets before applying machine learning algorithms, improving performance and reducing computational costs.
Where is Principal Component Analysis Used?
PCA finds its application in various sectors, demonstrating its versatility in tackling complex, high-dimensional data.
Biometrics
In facial recognition systems, PCA can reduce the dimensions of face images, making it easier to identify individuals.
Finance
PCA aids in risk management by simplifying factors affecting financial markets into principal components.
Genetics
It’s used to identify genetic patterns and relationships by reducing the dimensions of genetic information.
Market Research
PCA helps in identifying distinct customer segments by reducing variables in customer data.
Environmental Science
Data from various sensors can be overwhelming; PCA helps in identifying the principal factors affecting environmental conditions.
Why Use Principal Component Analysis?
Exploring the motivations behind using PCA can shine a light on its benefits in data analysis.
Data Simplification
The core advantage of PCA is its ability to simplify data, making it easier to explore and analyze.
Revealing Hidden Patterns
PCA can uncover patterns and relationships in the data that weren’t initially apparent.
Reducing Noise
By focusing on the components with the most variance, PCA helps in reducing the effect of noise in the data.
Improving Visualization
Reducing dimensions with PCA can make complex datasets more amenable to visualization.
Efficiency in Computation
Lower dimensionality means less computational resources are required, which is particularly beneficial in machine learning models.
How Principal Component Analysis Works
Understanding how PCA transforms your data can demystify the process and highlight its ingenious approach to reducing complexity.
Standardization
The first step involves standardizing the range of the variables to make sure they are on a similar scale.
Covariance Matrix Computation
PCA then calculates the covariance matrix to understand how the variables in the dataset are varying from the mean with respect to each other.
Eigenvalues and Eigenvectors
The covariance matrix is then decomposed into eigenvalues and eigenvectors. Eigenvectors determine the directions of the new space, and eigenvalues determine their magnitude.
Sorting Eigenvectors
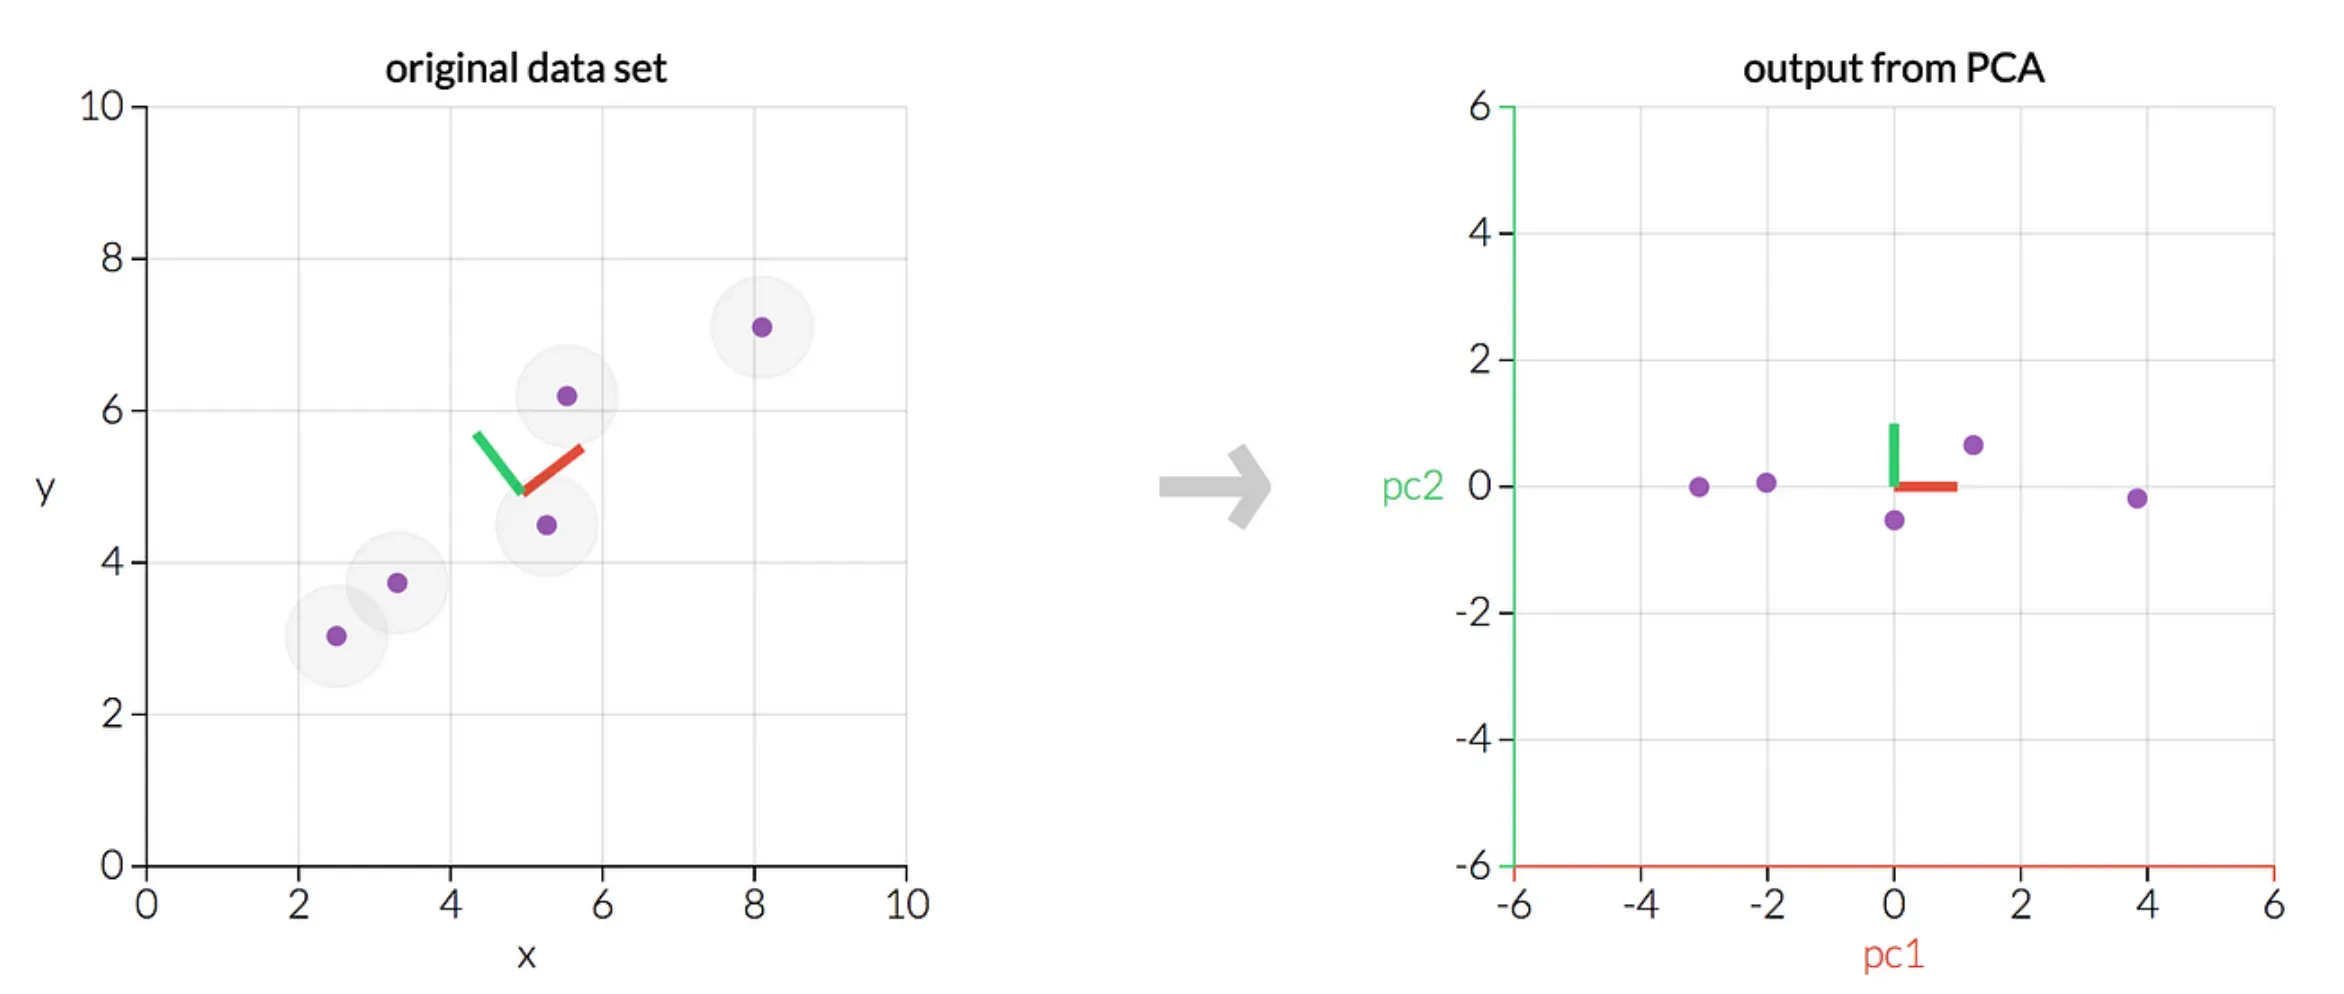
The eigenvectors are sorted according to their eigenvalues in descending order. The top eigenvectors form the new space axes.
Projection
Lastly, the original dataset is projected onto the new axis (formed by the top eigenvectors) to complete the transformation.
Mathematical Foundations of PCA
For those who love diving into the nitty-gritty, the mathematical underpinnings of PCA are both elegant and fascinating.
Linear Algebra
At its heart, PCA leverages concepts from linear algebra, especially the calculation and interpretation of eigenvectors and eigenvalues.
Statistics
Statistical theories underlie the creation of the covariance matrix and the understanding of variance and correlation in the dataset.
Orthogonal Transformation
PCA uses an orthogonal transformation, which ensures that the new axis system formed by the principal components is at right angles to each other.
Dimensionality Reduction Techniques
PCA is a cornerstone technique in the field of dimensionality reduction, showcasing the power of linear transformations.
Singular Value Decomposition
An alternative method to compute PCA is through Singular Value Decomposition (SVD), which can be more numerically stable in certain cases.
Best Practices in Principal Component Analysis
Getting the most out of PCA involves adhering to some best practices throughout the process.
Adequate Preprocessing
Ensure that your data is properly cleaned and normalized before applying PCA.
Choosing the Number of Components
Select the right number of principal components by considering the explained variance and the requirements of your analysis.
Interpretation of Components
Carefully interpret the principal components and understand their relationship to the original variables.
Avoid Overfitting
Be cautious not to overfit your model by relying too heavily on components that explain minimal variance.
Cross-validation
Use cross-validation techniques to ensure that the reduction in dimensions generalizes well to new data.
Challenges in Principal Component Analysis
Despite its utility, PCA is not without its challenges, which users need to navigate carefully.
Subjectivity in Interpretation
The interpretation of principal components can sometimes be subjective and may not always have a clear, straightforward meaning.
Loss of Information
While reducing dimensions, there's always a trade-off with the loss of some information.
Sensitivity to Outliers
PCA can be sensitive to outliers in the data, which can disproportionately affect the results.
Scalability
Handling extremely large datasets with PCA can be computationally intensive, requiring significant resources.
Assumption of Linearity
PCA assumes linear relationships among variables, which may not hold true for all datasets, potentially limiting its applicability.
Emerging Trends in Principal Component Analysis
As with any field, PCA continues to evolve, with emerging trends providing a glimpse into its future applications and improvements.
Integration with Machine Learning
The integration of PCA with machine learning algorithms is becoming more seamless, enhancing the ability to handle large-scale data.
Automated Component Selection
Advances in the automation of selecting the number of principal components promise to make PCA more user-friendly and efficient.
Real-time PCA
Developments in real-time PCA algorithms open up new possibilities for applications in streaming data and online data analysis.
PCA for Big Data
Optimizations and parallel processing techniques are making PCA more viable for big data applications, breaking down previous computational barriers.
Advances in Interpretability
Efforts to improve the interpretability of principal components could make PCA more accessible and insightful for a broader range of users.
In diving deep into Principal Component Analysis, we've unveiled its essence as a potent tool in the data scientist's arsenal, capable of distilling complexity and revealing the simplicity underlying the most daunting datasets.
Its blend of simplicity, power, and elegance makes PCA not just a technique but a cornerstone of modern data analysis, embodying the wisdom that sometimes, less truly is more.
Frequently Asked Questions (FAQs)
How Does Principal Component Analysis Simplify Data?
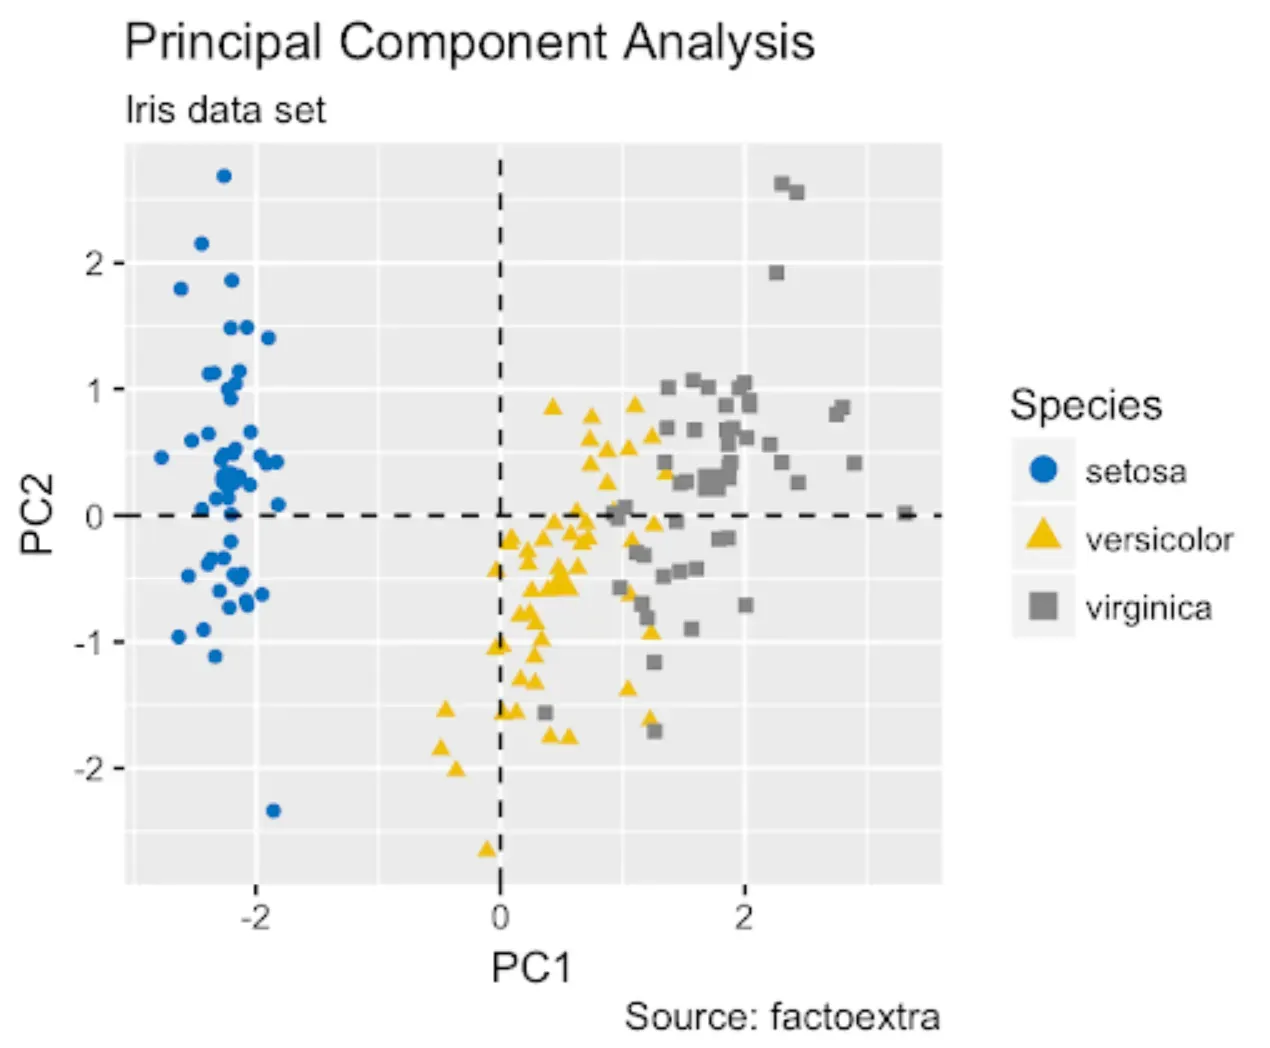
PCA simplifies data by reducing dimensions while preserving as much variance as possible, making complex data easier to explore and visualize.
Can PCA Be Used for Predictive Modeling?
Yes, PCA can be used to preprocess data, reducing dimensionality and noise before applying predictive modeling techniques.
How Does PCA Handle Correlated Variables?
PCA transforms correlated variables into a set of linearly uncorrelated variables called principal components, which capture the most variance.
What Is the Significance of Eigenvalues in PCA?
Eigenvalues indicate the amount of variance explained by each principal component, helping to identify the components that contribute most to the data's structure.
Can PCA Be Applied to Non-Numeric Data?
Directly, no. PCA requires numeric data. However, non-numeric data can be converted into numeric forms, such as through encoding, before applying PCA.
